Post-IPO Performance of Digital Health Companies in the U.S.: Widespread Price Breaks and Frequent High-Value Acquisitions
2018 was regarded by many investment banking practitioners as a “capital winter.” This year, with the formal implementation of the new asset management regulations, private equity firms and funds have been thrown into panic by the loss of access to cash pools, non-standardized assets, and off-balance-sheet financing.
Amid the backdrop of encouraging “mass entrepreneurship and innovation,” the demand for capital in the real economy, particularly among technology-driven innovative enterprises, is self-evident. However, despite tighter issuance approvals and a significant year-on-year decline in the number of initial public offerings (IPOs), investor enthusiasm for new listings remains limited, with shares frequently falling below their offer prices.
On July 9, 2017, smart hardware supplier Xiaomi listed on the Hong Kong Stock Exchange and was included in the Hang Seng Composite Index. In the following days, Xiaomi’s stock price fell below its IPO price for the first time, intensifying public debate over how the initial public offering would ultimately impact the company’s development.
So, is trading below the IPO price a common trend for tech innovation enterprises after their initial public offerings? VCBeat (WeChat ID: vcbeat) reviewed 26 digital health companies among the tech-focused innovative enterprises that have gone public in the U.S. capital markets since 2012, tracked their post-listing performance, sought to identify commonalities behind differing trends, and drew the following conclusions:
1. Post-IPO trading below the offering price is a common fate for most companies, yet the majority have managed to turn their fortunes around in the capital markets;
2. Stock prices of digital health companies tend to be volatile;
3. Sharp fluctuations and frequent divergences may contribute to a stock price correction;
4. An IPO may make digital health companies more attractive acquisition targets for larger corporations.
In terms of IPO year, all 26 digital health companies included in this review completed their initial public offerings between January 2012 and August 2018. The earliest founded company is LivaNova, a medical device supplier originally incorporated in the United Kingdom and established in 1987; the most recently founded is Arcus Biosciences, a biopharmaceutical company focused on cancer immunotherapy, which was incorporated in July 2015.
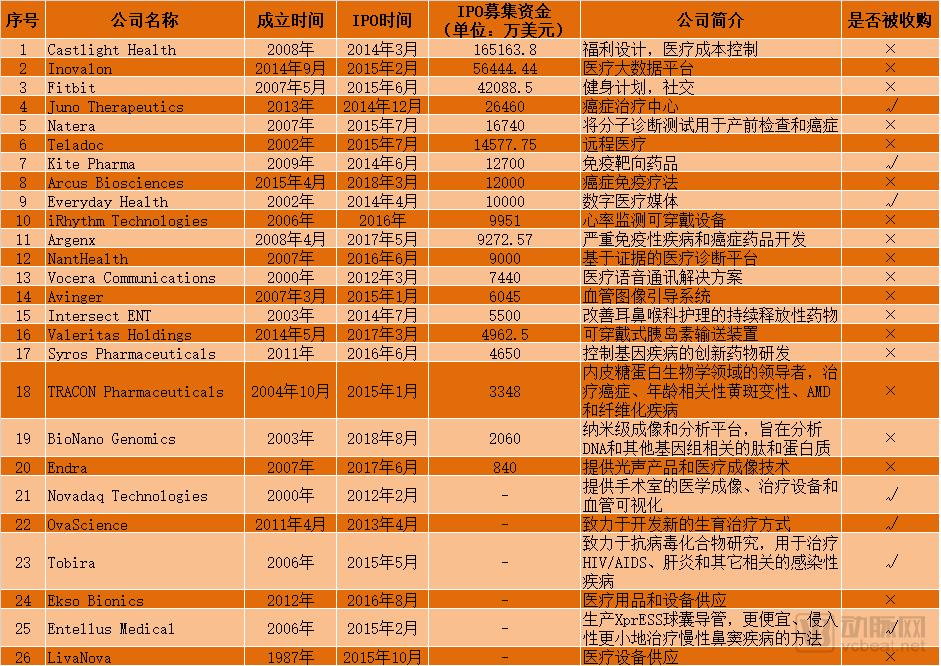
Summary of Information on 26 Digital Health Companies | Data Source: East Money Choice Data; Table Compiled by VCBeat
In terms of IPO speed, the medical big data platform Inovalon completed its listing process in the shortest time: established in September 2014, it listed on the NASDAQ in February 2015, taking only five months. LivaNova, the company with the longest founding history, was also the slowest to go public, finally listing in October 2015 after 18 years.
In addition, seven digital health companies were acquired after going public. Specifically, OvaScience, which is dedicated to developing innovative fertility treatments, announced in August 2018 that it would be acquired by Millendo Therapeutics, with the transaction amount undisclosed; cancer treatment center Juno Therapeutics was acquired by Celgene for $9 billion in early 2018; Entellus Medical, a medical device provider specializing in innovative treatments for chronic sinusitis, was acquired by Stryker for $662 million in December 2017; Kite Pharma, focusing on immune-targeted therapies, was acquired by Gilead Sciences for $11.9 billion in August 2017; digital health media company Everyday Health was acquired by Ziff Davis in October 2016; Novadaq Technologies, a provider of vascular visualization solutions, was acquired by Stryker for $701 million in June 2017; and Tobira, committed to research on antiviral compounds, was acquired by Allergan for $1.7 billion in September 2016.
These seven acquisitions were concentrated between 2016 and 2018, with all buyers being larger publicly listed pharmaceutical companies. Among them, Stryker completed two acquisitions, making it a relatively active buyer, although none of the transaction amounts exceeded $1 billion.
Among the 26 IPOs of digital health companies, only three have never traded below their offering price: iRhythm Technologies, a supplier of smart wearable cardiac rhythm monitoring devices; Argenx, a clinical-stage biotechnology company developing differentiated antibody therapies for severe immune disorders and cancer; and BioNano Genomics, a nanoscale imaging and analysis platform.
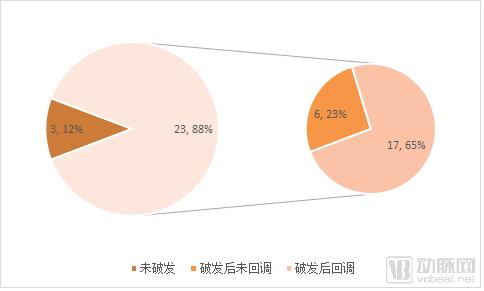
IPO Breakage Situation Data Source: East Money Choice Data; Chart by VCBeat
The other 23 companies fell below their IPO prices on the next trading day, several days later, or several months after listing. Among these 23 companies, six never saw their stock prices rise above the offering price again, while the remaining 17 rebounded to above their offering prices on the next trading day, several days later, or several months after falling below.
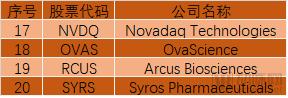
Regarding IPO Breaks
Thirteen companies, including the medical big data platform Inovalon, Juno Therapeutics, the cancer immunotherapy biotech Arcus Biosciences, Everyday Health, the evidence-based medical diagnostics platform NantHealth, healthcare voice communication solutions provider Vocera Communications, sustained-release ENT drug manufacturer Intersect ENT, wearable insulin delivery device supplier Valeritas Holdings, endoglin biology leader TRACON Pharmaceuticals, medical imaging technology provider Endra, Novadaq Technologies, OvaScience, and LivaNova, saw their stock prices fall below the IPO offering price on the first day of trading, marking the fastest decline. In contrast, Entellus Medical’s stock took the longest to break its issue price, fluctuating for 179 trading days after its listing before closing below the offering price for the first time.
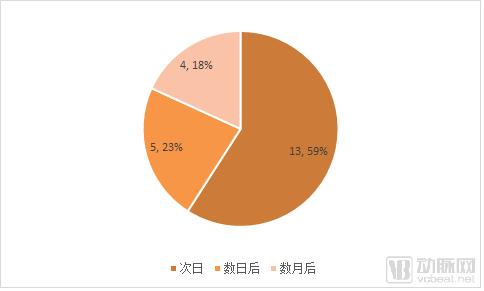
Time of Breaking Issue Price Data Source: East Money Choice Data; Chart by VCBeat
Callback Aspect
The six companies whose stock prices did not pull back were Castlight Health, the healthcare cost-containment solution provider that raised the most funds in its IPO; Inovalon; Fitbit, a health plan services provider; Natera, a molecular diagnostics technology provider; Arcus Biosciences; and NantHealth. The stock prices of Juno Therapeutics, Vocera Communications, and Ekso Bionics, a medical supplies and equipment supplier, all completed their pullback on the day after their IPOs broke the issue price. Avinger, a provider of vascular image-guided system solutions, took the longest to recover, with its stock price rising above the issue price only after 111 trading days following the break below the issue price.
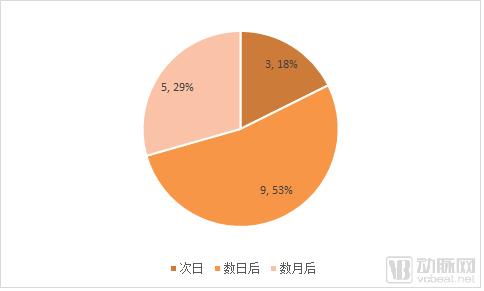
Pullback Time Data Source: East Money Choice Data; Chart by VCBeat
We can summarize as follows: from 2012 to 2018, falling below the IPO offering price was the predominant trend for digital health companies after their public listings. Among those experiencing such declines, more than half broke the issue price on the first day of trading, and more than half required at least two additional trading days to complete their price correction after the initial drop. A comparison reveals that the proportion of companies breaking the issue price on the next trading day is comparable to the proportion of those undergoing price corrections several days later.
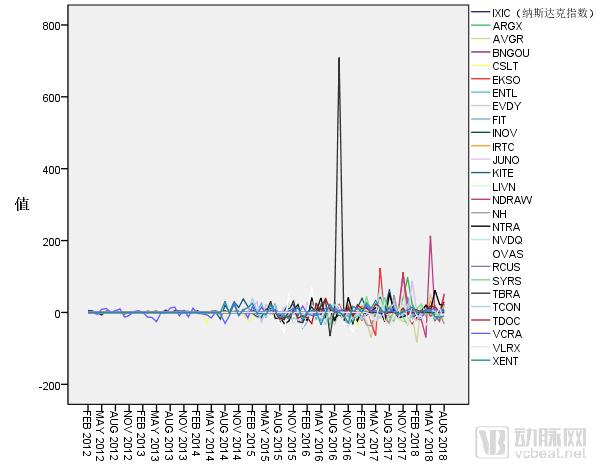
Among the 26 digital health companies, 20 are listed on the Nasdaq Stock Market, accounting for more than three-quarters of the total. Therefore, when comparing each company’s stock price trend with broader market fluctuations, we use the growth rate of the Nasdaq Composite Index as a benchmark for market volatility. Meanwhile, plotting all 26 stocks on a single chart would create visual clutter; thus, we have grouped the companies alphabetically into simple clusters, each comprising approximately four companies.
This section presents a brief technical analysis of stock prices, which is relatively uninteresting. Readers may simply skim the charts and proceed to the next section for the analysis and conclusions.
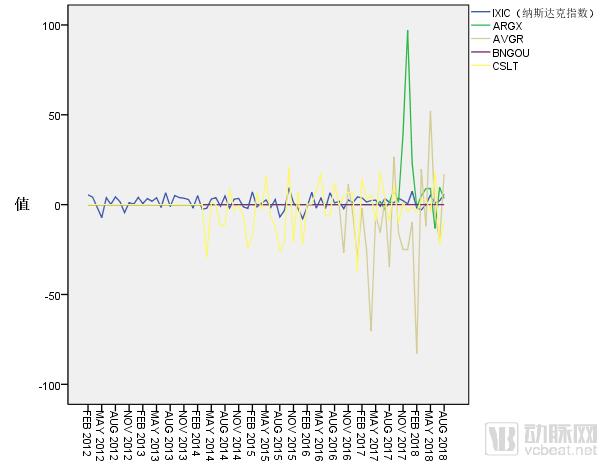
Group1
Although the stock price growth rates represented by AVGR and CLST exhibited greater volatility, their trends were largely consistent with that of the Nasdaq Composite Index. As an indicator of the overall market average, the Nasdaq Composite Index displays a relatively smooth curve due to the smoothing effect of mean reversion. In contrast, the trend for ARGX diverged significantly from the broader market. In this article, we primarily assess the similarity in trend patterns based on the positions of phase-specific peaks and troughs. Notably, between August and November 2017, ARGX’s stock price moved in a direction completely opposite to that of the Nasdaq Composite Index, nearly doubling in value.
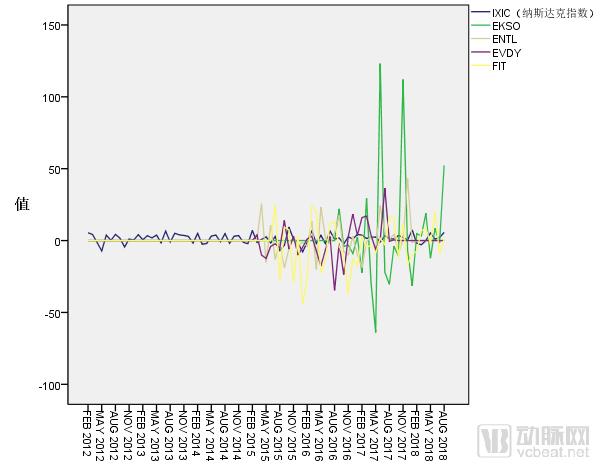
Group2
The curve representing EKSO moved in line with the broader market during periods of mild stock price volatility, but diverged completely from the broader market trend when more pronounced peaks and troughs emerged. Specifically, between April and June 2017, June to August 2017, and October to December 2017, the EKSO curve exhibited three major divergences from the Nasdaq curve: the first was a contrary decline, while the latter two were contrary rallies, each exceeding 50% in magnitude, with the two rallies even surpassing 100% respectively.
ENTL is relatively stable, but deviates from the broader market more frequently.
EVDY, by contrast, saw a rare deviation in early 2015 during its three years since listing on the NYSE.
FIT’s trend largely aligns with the broader market, but its peaks rise more rapidly and its troughs decline more slowly.
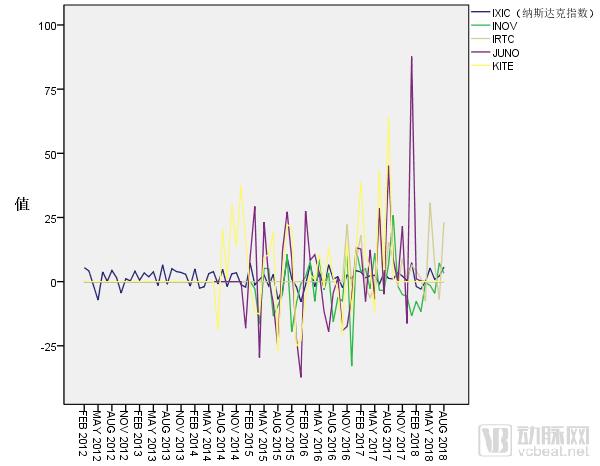
Group3
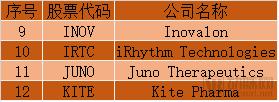
The star company in Group 3 is JUNO. In less than four years, JUNO’s stock price experienced fluctuations exceeding 25% during seven months, with the amplitude surpassing 75% in the first two months of 2018. However, among these seven instances of sharp stock price volatility, only one moved counter to the broader market, occurring in April 2015.
Next is KITE, which recorded five instances of growth exceeding 25%, four of which moved counter to the broader market trend.
Furthermore, INOV’s stock price moved in line with the broader market until the end of 2017, but diverged completely twice after entering 2018, with opposite directions and trends; IRTC’s performance closely tracked the broader market, with only one instance of divergence.
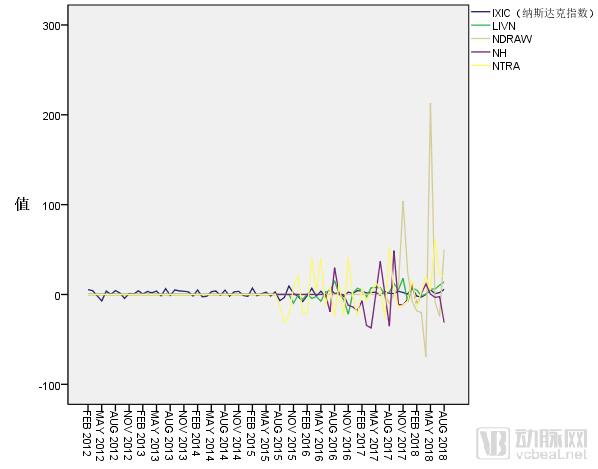
Group4
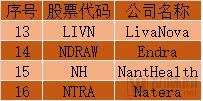
NDRAW is the undisputed star of Group 4, and may even be the company with the most noteworthy stock price volatility among those reviewed in this report. Between April and July 2018, NDRAW’s stock price fluctuated by more than 300%, with its largest single surge exceeding 200% and its sharpest decline approaching 100%. Another instance of NDRAW’s stock price rising by over 100% occurred between October and December 2017.
Furthermore, NTRA’s stock price has experienced significant volatility, with frequent instances of counter-trend rallies and declines; NH exhibits a similar pattern. LIVN’s stock price fluctuations have been relatively moderate; however, during periods of heightened volatility, its performance tends to move inversely to the broader market.
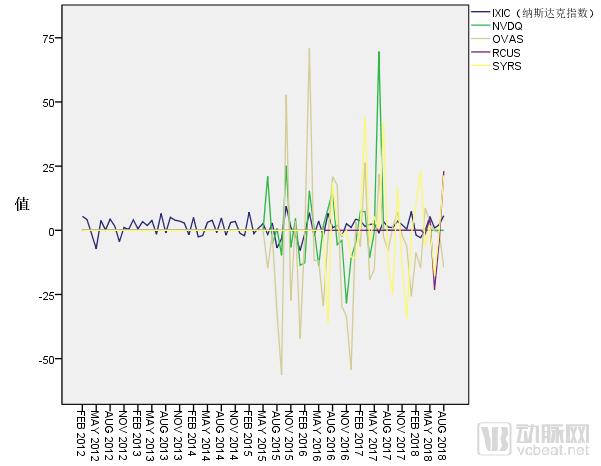
Group5
As can be seen from the scale of the vertical axis, the stock price fluctuations of companies in Group 5 were relatively smaller than those in other groups during the observation period, with no increases or decreases exceeding 75%.
Among them, OVAS exhibited the greatest volatility, with four instances of price fluctuations exceeding 50%. However, only one of these was completely opposite to the broader market’s direction and trend, occurring between December 2016 and February 2017. In February 2018, OVAS showed another trend that was entirely contrary to the broader market, while during other periods its performance closely aligned with the broader market.
Next is NVDQ, which saw a maximum increase of nearly 75% and moved counter to the broader market trend in June 2017. In addition, SYRS exhibited frequent volatility, with five instances of price swings exceeding 25% during the observation period; two of these occurred against the broader market trend, specifically in June 2016 and April 2018. RCUS has been listed for a relatively short period, and its performance has closely tracked that of the broader market.
Group6
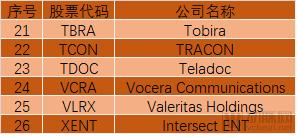
Among the 26 companies, the biggest star, TBRA, appeared in Group 6. TBRA’s stock price surged by more than 700%, occurring between August and October 2016, but its direction and trend were largely consistent with the broader market. Next was VLRX, which experienced two stock price increases of over 75%, occurring in June and October 2017, respectively. During periods of significant volatility, VLRX’s performance moved contrary to the broader market. Additionally, the strategies and stock trends of TCON, TDOC, and VCRA were relatively close to those of the broader market.
We found that, regardless of whether they traded below their IPO price, the stock prices of 26 digital health companies exhibited more intense volatility and frequent divergence from the broader market. Among the six companies whose stock prices did not correct, four showed price trends closely aligned with the broader market. We speculate that counter-trend volatility is more conducive to subsequent price corrections. Abnormal stock price fluctuations are often driven by specific events; for digital health companies, acquisitions are likely the most significant catalysts for dramatic price swings. For example, Tobira’s largest price surge, exceeding 700%, occurred between August and October 2016, with the company announcing its acquisition in September of that year. Similarly, in June 2017, Novadaq Technologies experienced its only monthly price increase of over 75% since its IPO, coinciding with news of its acquisition.