Forbes: Analyzing the 2018 Biotech IPO Boom Through Post-Market Performance
Recently, Forbes published an article titled “Viewing the 2018 Biotech IPO Boom Through the Aftermarket.” The article highlights that the initial public offerings (IPOs) of biotechnology companies in 2018 were exceptionally hot. VCBeat (WeChat Official Account: vcbeat) has compiled and translated the main content of this article for you.
In the first three quarters of 2018, biotechnology companies launched nearly 50 new products, reinforcing the strong issuance performance seen over the past six years. Given that many experts have expressed concerns about market overheating or have overly emphasized negative factors during market downturns, it is worth considering how this year’s post-IPO stock performance aligns with data from previous years.
Geoffrey Porges of Leerink recently published a valuable report examining the entire IPO window and returns on new biotechnology products from 2013 to 2018. As expected, the median performance distribution was unattractive; however, approximately 20% of companies captured the majority of share price and valuation gains, reflecting the Pareto principle (the 80/20 rule).
Based on IPO stock performance data from BMO Capital Markets, the following shows the distribution of 48 biotechnology IPOs listed as of September 30, 2018. The chart clearly indicates that the share prices of most companies (58%) have reached or exceeded their IPO prices. Some major companies have delivered substantial returns, such as ARMO, Solid Biosciences, and Allakos. Conversely, poor data can also rapidly devastate a stock’s performance, as seen with Menlo.
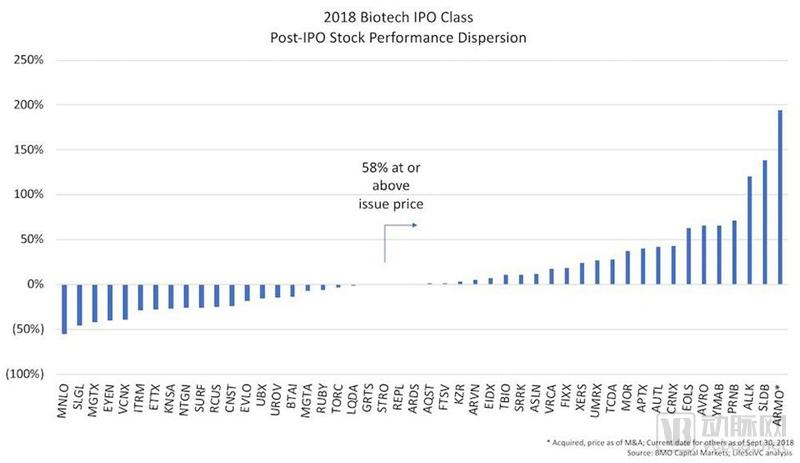
Post-IPO Performance Dispersion
Comparing this performance distribution with previous annual IPO cohorts reveals that many of them have had longer trading histories in the market. As expected, with extended time in the market, stock price performance becomes more dispersed at both the high and low ends (including the 75th and 25th percentiles).
Since 2010, the median price change for the entire IPO cohort has been -2.9%, while the mean stands at 69%, a figure skewed by significant outliers. In 2015, the NASDAQ Biotech Index hit a record high in July, yet it remains the worst-performing segment, with a median return of -50% to date. Nevertheless, the top quartile has achieved growth exceeding 80% over the past three years.
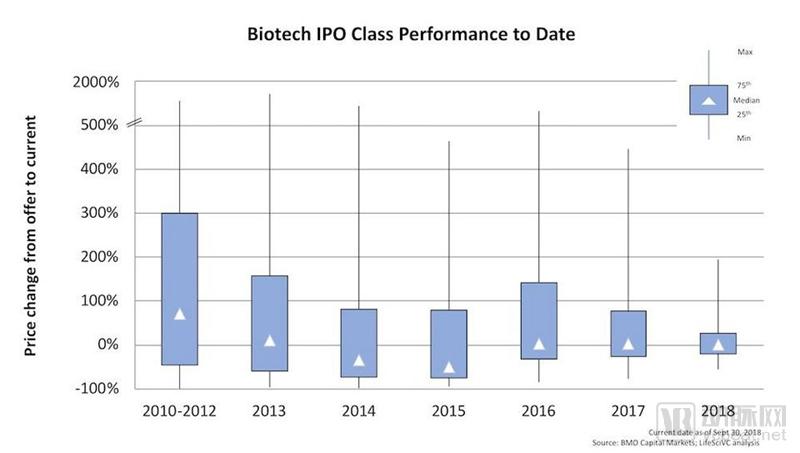
Biotech Stock Performance Post-IPO
Another way to observe the dispersed post-market performance is to examine the proportion of IPOs that remain trading above their initial offering price. Historically, this figure has typically ranged from 40% to 60% at any given point after the IPO. For example, as of October 2007, near the market peak of the preceding decade, 41% of biotechnology IPOs issued between 2003 and 2007 were trading above their offering prices. The situation was even worse during the financial crisis; by June 2009, only 21% of these companies had stock prices exceeding their offering prices. Of course, this situation has improved in recent years.
This is a breakdown of IPO windows for the most recent year ending September 30. In 2018, 58% of IPOs traded above their offering prices, compared to less than 40% in 2014 and 2015. Given the volatility over the past two weeks, these figures may decline slightly by mid-October.
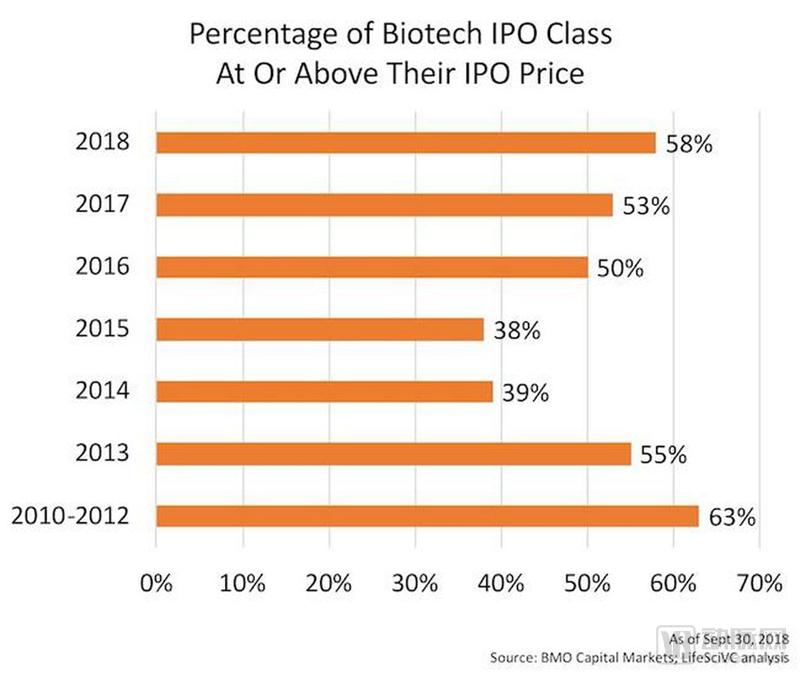
Percentage of Companies with Stock Prices Above Their IPO Price as of September 30, 2018
However, volatility is an inherent characteristic of the biotechnology sector and will not disappear. Our trading is event-driven, and data can have a significant impact on it. Even in the absence of data, market sentiment can shift. Over time, without a reliable flow of news, stock prices tend to weaken. Liquidity is very tight, so small changes in buying and selling activity often lead to large fluctuations in stock prices.
To capture the volatility of post-listing companies, Jefferies’ Matthew Kim tasked his team with an interesting analysis: what proportion of IPOs have never traded below their initial offering price? According to Jefferies’ analysis, only 14% of healthcare companies have remained trouble-free since 2013. The same holds true for biotech IPOs. Even large companies such as Agios and Juno have seen their stock prices fall below the IPO offer price at some point after listing. Given the impact of market timing and volatility, it is understandable that more IPOs failed in 2015. Overall, a higher proportion of recently listed companies went public via IPO.
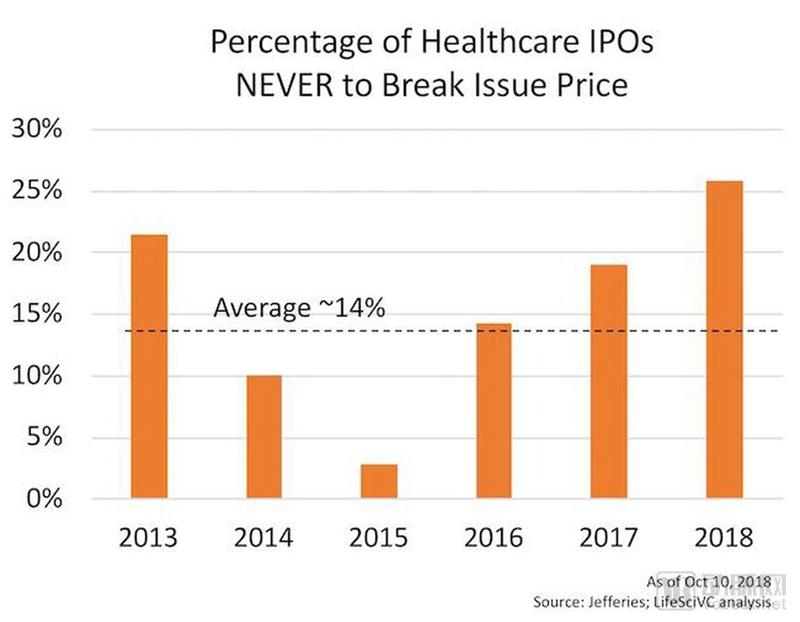 BiotechnologyIPOs “Never” Break Their Issue Price
It is evident that 2013–2018 was the most active period for IPOs in the history of biotechnology. A rarely mentioned metric is the consistency of IPO activity in the market. In most years before the rise of the biotech sector, there were extended periods with no IPO activity. Since the current IPO window truly opened in March 2013, 66 months have passed.
According to BMO data, there were no initial public offerings (IPOs) during the four-month period spanning December 2016 to January 2017 and February to March 2017. In contrast, across the remaining 62 months, at least one biotechnology IPO occurred every month, averaging more than one per week, a trend that persisted for nearly six years.
Post-IPO stock price volatility and divergence trends are expected to revolve around the following themes:
1. From the initial public offering onwards, we expect 40%-60% of IPOs to trade below their issue price, particularly when the market has undergone sufficient adjustment;
2. The vast majority of biotechnology companies will break their IPO price caps and trade below their offering prices at some point during the drug development process;
3. Less than 20% of products will continue to drive the majority of market returns for companies following their initial public offerings;
4. Given the sustained level of IPO activity, we may have entered a phase in which companies with credible therapeutic products can go public in almost any macroeconomic environment.
In short, these and other data indicate that the capital markets we operate in are far more mature and resilient than the environment during the first few decades of the biotechnology industry.