Inside the U.S. Pharmaceutical Market: Size, PBMs, Pricing Complexity, and Generic Competition
Editor’s Note: This article is reprinted from Tongxieyi, authored by Meng Bayi. VCBeat has been authorized to republish it.
In terms of pharmaceuticals, the United States is a global leader in innovation, production, and sales, as well as a major consumer of medications. The U.S. accounts for 40% of global annual pharmaceutical consumption. Its vast market, high consumption levels, and favorable pricing attract pharmaceutical companies worldwide to seek opportunities in the American market.
What is the U.S. pharmaceutical sales market like, and what are its key characteristics? This article adopts a narrative style, sharing my limited insights into the U.S. market with readers as thoughts come to mind. It aims to outline the general landscape of the U.S. pharmaceutical market. The article focuses on the following:
1) The U.S. pharmaceutical market is vast;
2) Pharmacy Benefit Management (PBM) is highly specialized;
3) The drug pricing system is complex;
4) The generic drug market is highly competitive.
Intended only to spark further discussion, this piece does not claim to be comprehensive or rigorous. There may be errors in the data and logic; corrections are welcome.
① A Nation of Pill-Poppers
In the 1960s, after completing the modern industrial revolution, the United States saw its medical and pharmaceutical sciences rise to global dominance. During this period, healthcare and medication became major components of social consumption, while health and pharmaceutical policies emerged as significant political stakes for American politicians.
Figure 1. Ratio of U.S. Healthcare Expenditure to U.S. GDP, 1929–2010
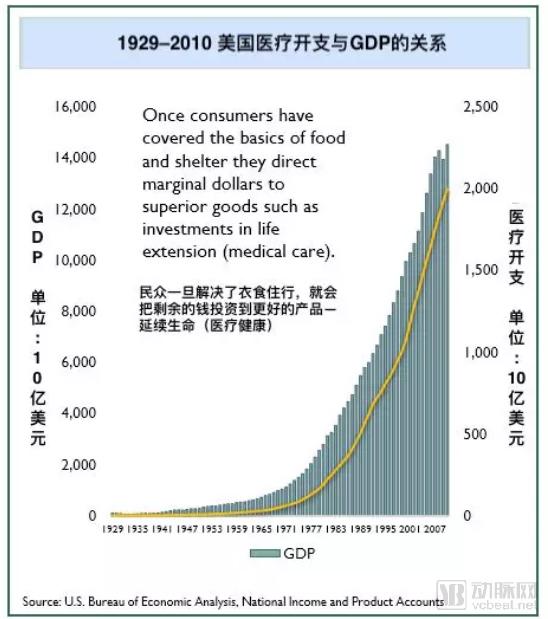
Source: Generic Pharmaceutical Industry Yearbook, GPhA Conference Edition, February 2016
In 2018, U.S. healthcare expenditures reached $3.7 trillion, accounting for 18.9% of the nation's GDP, with prescription drug spending comprising 12% of this total.
② Insurance coverage as the primary payer
Underpinning such enormous pharmaceutical consumption is the vast and complex U.S. healthcare financing system, comprising government-sponsored programs and commercial insurance. In 1965 and 1982, the United States enacted two major rounds of amendments to its healthcare legislation, establishing the broadly inclusive, government-funded Medicare program (for the elderly) and Medicaid program (for low-income individuals). These reforms mandated employers to purchase commercial health insurance for their employees, and under the Obama administration, individuals were even required to enroll in commercial health insurance. Together, the U.S. government and the commercial sector have built a robust healthcare payment system.
Figure 2. Sources of Payment for Retail Prescription Drugs in the United States, 2016
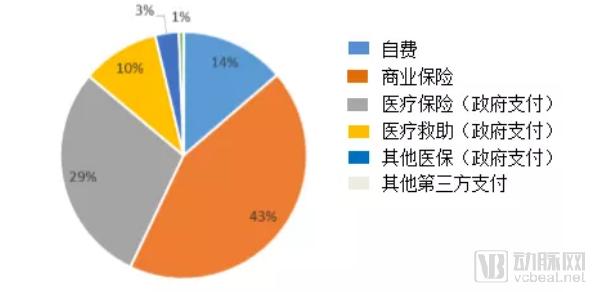
Source: www.jhsph.edu/pharmaceuticalpolicy
③ Uncontrolled Drug Consumption
The “Nation of Pill-Poppers” Propped Up by Insurance Payments Has Led to Out-of-Control Prescription Drug Consumption in the United States. In 2017, the U.S. prescription drug market was valued at approximately $400 billion, with an average of 12 prescriptions written per person annually and per capita spending reaching $1,150. Prescription drug expenditures accounted for nearly 11% of total healthcare spending and 2% of the entire U.S. GDP. Costs borne by government health insurance programs and commercial insurers have surged unchecked, approaching a state of near unmanageability. Today, healthcare costs have become a heavy financial burden for the American middle class and some low-income individuals.
Figure 3. Changes in Prescription Drug Consumption in the United States, 1994–2014
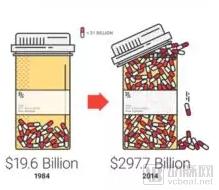
Source: Kaiser Family Foundation, 2015
Over the 30-year period from 1984 to 2014, U.S. prescription drug spending surged from $19.6 billion to nearly $300 billion. From 2008 to 2015, the average price of prescription drugs rose by 164%, while the Consumer Price Index increased by only 12% during the same period!
Various insurance payments have not only stimulated drug consumption but also caused consumers to lose their “sense of paying for medications.”
Figure 4. Statistics on Perceived Prescription Drug Consumption in 2016
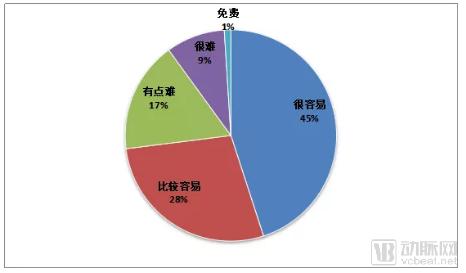
Source: Compiled by the author based on data from the Kaiser Family Foundation Health Tracking Poll, September 14–20, 2016
Monopolistic operations, free pricing, and insurance reimbursement have established the United States as the world’s largest consumer of pharmaceuticals and secured its position as the leading global drug market. Pharmaceutical companies worldwide are eager to enter the U.S. market to test their competitiveness.
① Complex Sales
The U.S. drug sales system is highly complex. This intricate framework reflects a web of complex interests.
Figure 5. Simplified Diagram of the U.S. Pharmaceutical Sales Process
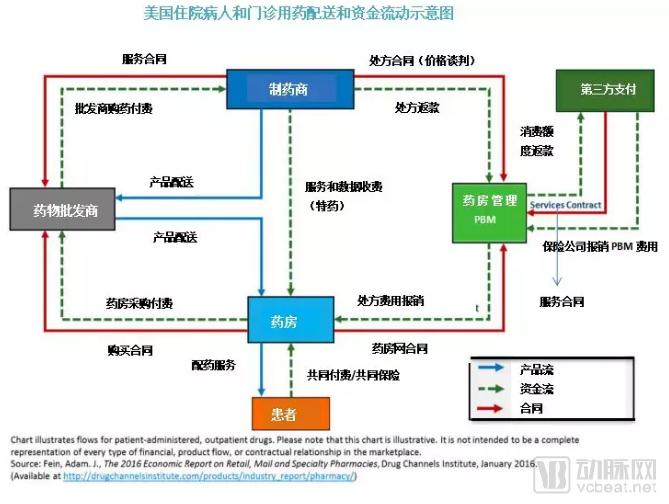
Figure 6: Simulated Distribution of Sales Profits for a $300 Drug
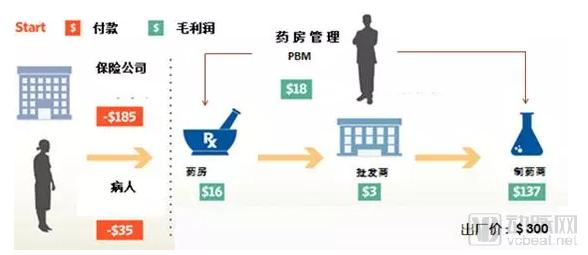
Source: Compiled by the author based on images provided by The Wall Street Journal in 2018
As can be inferred from Figure 6, ($185 + $35) - $16 - $18 - $3 - $137 = $46. The manufacturing cost of a drug valued at $300 is merely $46. Who is making the big profits?
Figure 7. Distribution of Profits in the U.S. Pharmaceutical Market, 2017 (Unit: $100 Million)
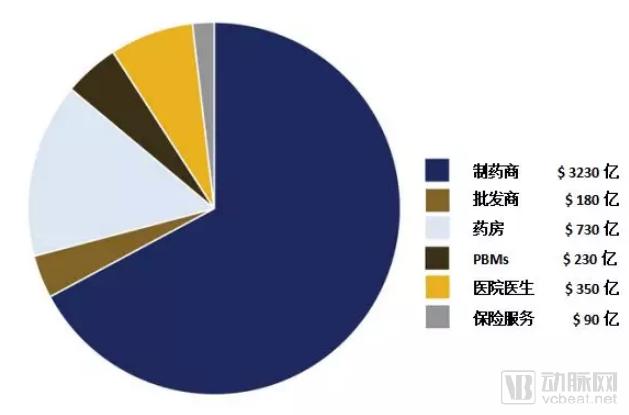
Source: Health Fair by Nancy L. Yu, Preston Atteberry, and Peter B. Bach, 2018
Pharmaceutical manufacturers capture approximately 70% of the revenue across the entire drug sales chain. Some analyses suggest that profits from patented drugs in the United States even exceed those of the U.S. tobacco industry (Source: USC Schaeffer, Leonard D. Schaeffer Center for Health Policy & Economics, 2017).
There are approximately 67,000 drug dispensing outlets in the United States, most of which are retail chains, with the remainder being independent pharmacies, generating a total annual revenue exceeding $270 billion. In 2016, around 6 billion prescriptions were issued in the U.S., including approximately 5 billion for prescription drugs. The three major wholesalers—McKesson, AmerisourceBergen, and Cardinal Health—control 90% of prescription drug sales, while the three leading pharmacy benefit managers (PBMs), CVS Health, Express Scripts, and OptumRx, processed approximately 3.5 billion prescriptions.
Pharmacy Benefits Management (PBM) plays an indispensable intermediary role in pharmaceutical transactions in the United States.
Pharmacy Benefit Management (PBM) originated from mail-order pharmacy services in the 1960s, with the initial aim of merely addressing the challenge of obtaining medications across different locations. Over time, mail-order pharmacy providers accumulated extensive data on patients, physicians, medications, health insurance, suppliers, and purchasers.
In the late 1980s, with the rise of computer technology, Pharmacy Benefit Managers (PBMs) began providing medication purchasing advice to patients and health insurance companies, evaluating drug prescriptions, monitoring rational drug use, procuring discounted medications, and offering centralized procurement services. Over time, their role expanded to include negotiating on behalf of insurance companies, hospitals, physicians, and pharmaceutical manufacturers.
In the 1990s, PBM companies issued "prescription drug cards" to consumers, allowing cardholders to enjoy discounted prices negotiated by PBMs when purchasing medications at designated pharmacies. As more pharmacies joined the PBM networks and the user base expanded, PBMs’ negotiating power grew increasingly stronger. Over time, the PBM business model gradually became an indispensable component of the U.S. healthcare market and pharmaceutical economy.
Figure 8. Simulated $100 Drug Transaction Involving PBM Participation
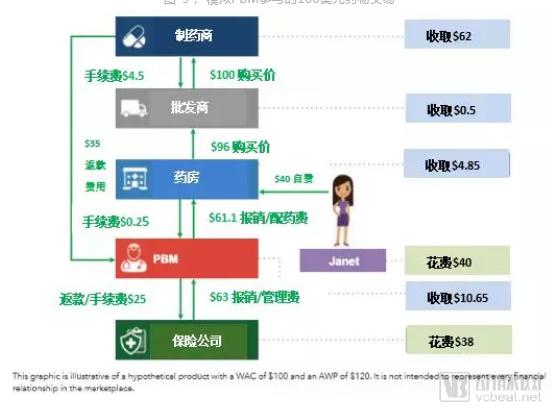
Source: Compiled based on PhRMA, November 2017
The scenario depicted in the figure is that Janet purchased $100 worth of prescription drugs. Through the operations of the Pharmacy Benefit Manager (PBM), the pharmaceutical manufacturer received $62, the wholesaler received $0.50, the pharmacy earned $4.58, and the PBM earned $10.65. Janet and her insurance company actually incurred a cost of $78. This figure vividly illustrates the PBM’s role as an intermediary in pharmaceutical transactions.
We categorize the role of PBMs into two components: services and benefits.
① Services
Third-Party Administration (TPA): Administers insurance operations for individuals and groups, including commercial health insurance, employer-sponsored insurance plans, government medical insurance programs, the Federal Employees Health Benefits Program (FEHBP), and veterans’ funds. In simple terms, Pharmacy Benefit Managers (PBMs) act on behalf of insurance companies or healthcare payers to liaise with enterprises that provide services and products.
Intermediaries in pharmaceutical transactions provide services such as price inquiries, centralized procurement, and even financial services like advance payments.
By leveraging the robust collective purchasing power and product bargaining strength derived from a large-scale customer network, we negotiate to provide service recipients with optimal treatment plans and assist healthcare payers or insurance companies in formulating the most favorable health insurance terms.
Formulating Drug Tiering and Formulary Coverage: PBMs, physicians, and clinical experts collaborate to define the scope of covered prescription drugs and tier structures for clients.
# Formulating Treatment Pathways: Ensure Patients Receive Proven Effective Medication Before Adopting High-Cost Drugs.
Prescription Review: Regulate effective treatment, prevent prescription abuse, and help insurers manage the use of high-cost and complex specialty medications.
Allocate rebates or refunds to insurance companies, medical insurance payers, and pharmacies in accordance with the contract.
② Interests
Service Fees
Negotiating Drug Prices
Receive rebates or refunds
The figure below illustrates the revenue sources of PBMs.
Figure 9. Revenue Distribution of U.S. PBM Business Segments, 2002–2016
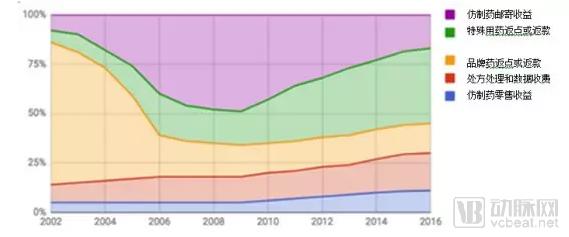
Source: Abrams papers on Medco through 2008; estimates thereafter.
Since 1990, the rapid development of computer and internet technologies has fully highlighted the advantages of Pharmacy Benefit Managers (PBMs). PBMs have emerged as a significant force in the pharmaceutical sales supply chain, continuously expanding their business scope. By establishing sales networks and even acquiring retail and chain pharmacies, PBMs have built their own omnichannel pharmaceutical sales and service networks, integrating brick-and-mortar stores, mail-order services, and online platforms powered by computer networks.
Through computational and data analytics, Pharmacy Benefit Managers (PBMs) provide increasingly extensive, convenient, and practical services to insurance companies, patients, physicians, hospitals, and pharmaceutical manufacturers. In recent years, mergers, acquisitions, and restructuring among PBMs, wholesalers, and insurers have created a more massive monopolistic service and profit chain. It can now be said that PBMs have virtually achieved a complete monopoly over drug sales in the United States.
The success of PBMs in the United States began in the 1980s, when new thinking and technologies disrupted the traditional pharmaceutical sales model. PBMs have evolved from simple mail-order pharmacy services into comprehensive pharmaceutical intermediaries that integrate medication management, consultation, custody, regulatory oversight, and financial services.
Some argue that the 1984 U.S. legislative reform on generic drugs (the Hatch-Waxman Act) and the concurrent rise of pharmacy benefit managers (PBMs) were two key factors that reshaped the definition of pharmaceuticals in the United States (through generic substitution) and established the modern U.S. pharmaceutical marketing system.
In 2016, the three largest PBMs in the United States were CVS Health (aka Caremark), Express Scripts, and OptumRx.
In 2016, Express Scripts reported a profit of $3.4 billion, while OptumRx recorded $2.7 billion. Data for CVS Health (also known as Caremark) in 2016 were not available. However, based on the figure that CVS Health (also known as Caremark) processed 1.2 billion prescriptions in 2016, if “specialty prescriptions” are taken into account, this volume is equivalent to processing 1.6 billion standard prescriptions.
Figure 10. Statistics on Prescription Audit Share of Major U.S. Pharmacy Benefit Managers (PBMs) in 2016
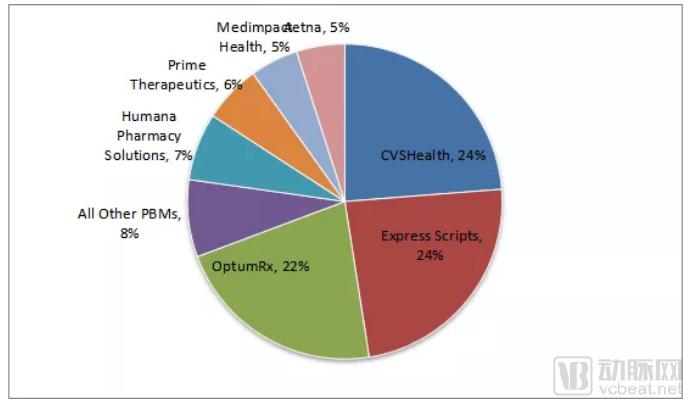
Source: PhRMA, November 2017
In other words, in 2016, the three major PBMs processed approximately 3.5 billion drug prescriptions, accounting for 70% of the total volume of prescription drugs.
Why Do Three PBMs Monopolize 70% of the Bargaining Power Over Drug Prices in the United States? Why Do PBMs Play Such a Critical Role in Drug Pricing?
This is primarily due to the relatively fragmented nature of commercial health insurance in the United States, where insurers lack strong individual bargaining power against pharmaceutical manufacturers compared to Pharmacy Benefit Managers (PBMs). Secondly, the U.S. Centers for Medicare & Medicaid Services (CMS) has entrusted the management of national health insurance and government employee health insurance programs to PBMs. As the primary purchaser in the pharmaceutical market, government-sponsored insurance programs significantly influence the industry; many commercial insurers benchmark their coverage terms and policies against Medicare and Medicaid. Consequently, numerous commercial insurers have also outsourced their insurance operations to PBMs.
In theory, the more resources a Pharmacy Benefit Manager (PBM) manages, the greater its bargaining power with pharmaceutical manufacturers, and the lower the drug prices that plan sponsors should secure. In this way, commercial PBMs have gradually become invisible operators in the U.S. healthcare market. However, there is an inherent conflict of interest between the economic objectives of health insurance management (rationality and cost savings) and the commercial nature of PBMs.
For years, the lack of transparency in PBM companies’ dealings with pharmaceutical manufacturers and insurers has obscured their actual profits, leading to mixed reactions from public opinion, the general public, and politicians.
Proponents argue that PBMs serve as intermediaries that optimize the cost-effectiveness of the U.S. pharmaceutical market, making significant contributions by promoting rational medication use among American consumers, reducing healthcare expenditures, and balancing market dynamics. Critics, however, contend that PBMs are primary drivers of high drug prices in the United States, acting as unethical profiteers who collude with pharmaceutical manufacturers and insurers to exploit the public’s wealth.
Over the years, drug consumption in the United States has continued to rise, with individuals spending increasingly more on prescription medications. Whether this trend is attributable to Pharmacy Benefit Managers (PBMs) remains unclear. Regardless of whether they are praised or criticized, the reality is that the U.S. pharmaceutical market can no longer revert to an era without PBMs.
It is widely known that drug prices in the United States are high, a source of universal complaint. Every president has pledged to address this issue, yet to this day, pharmaceutical pricing remains a major problem in American society.
① U.S. Drug Pricing Law
The Hatch-Waxman Act of 1984
On one hand, the Act extended the patent protection period for drugs, granting patented medicines a longer duration of exclusivity. On the other hand, it fundamentally redefined generic drugs, making their market entry extremely streamlined. The Hatch-Waxman Act ushered in a new era of generic drug substitution for prescription medications in the United States. From 1984 to 2017, the share of generics in total prescriptions rose from 18% to 92%, while generics accounted for only 23% of total prescription drug spending. The Hatch-Waxman Act has fundamentally addressed the issue of medication accessibility.
The 1990 OBRA Act (Medicaid Drug Rebate Program)
In 1990, George H. W. Bush approved the Omnibus Budget Reconciliation Act (OBRA). The act mandated that pharmaceutical manufacturers disclose the Average Manufacturer Price (AMP) of drugs and provide price discounts to government programs such as Medicaid.
The legislation mandates that pharmaceutical manufacturers enter into agreements with the government to ensure that brand-name drugs receive a 5–25% discount within government-covered programs, while generic drugs must not exceed the Federal Upper Limit (FUL) established by Medicare and Medicaid. If a manufacturer sells to any other company, group, or individual at a price lower than the government-capped price or below the FUL, such conduct constitutes a violation of law and is deemed “price fraud” against government programs.
However, the OBRA Act also stipulates that the public has no right to access details of drug transactions below the Average Manufacturer Price (AMP). The original intent of the OBRA Act was to curb rising drug prices and enable government health insurance programs to secure lower drug prices. Yet, the outcome has been that, rather than lowering drug prices overall in the U.S. market, it has provided a legal basis for drug price collusion.
1992 Project 304B
In 1992, the U.S. Congress enacted the “340B Program,” requiring pharmaceutical manufacturers to provide drugs at discounted prices below the Average Wholesale Price (AWP) to hospitals participating in government programs, thereby reducing medication costs for these programs.
2003 Medicare Part D
In 2003, the U.S. Congress passed Medicare Part D (the Medicare Prescription Drug, Improvement, and Modernization Act), proposed by Republican lawmakers. The legislation stipulated that, to maintain fair market competition, the U.S. government—specifically the Department of Health and Human Services (HHS)—was prohibited from negotiating drug prices with pharmaceutical manufacturers. In effect, this barred the government-sponsored insurance programs, Medicare and Medicaid, which accounted for the largest share (34%) of healthcare expenditures at the time, from negotiating drug prices with pharmaceutical companies.
From the U.S. drug pricing laws, it is evident that American politicians have consistently favored free-market pricing for pharmaceuticals.
The United States is the only developed country that does not regulate drug prices. Government health insurance accounts for 43% of prescription drug consumption, with Medicare alone covering 60 million elderly Americans. In 2003, Medicare Part D stipulated that government health insurance programs could not restrict coverage of medications (any FDA-approved drug must be covered) and simultaneously prohibited government agencies from negotiating prices with pharmaceutical manufacturers.
In 2010, Obama attempted to change this law through the “Patient Protection and Affordable Care Act” (PPACA), but was rejected by Congressional Republicans.
The U.S. pharmaceutical industry is underpinned by a legal framework comprising the Patent Protection Act, the Free Pricing Act, the Drug Substitution Act, and the Health Insurance Reimbursement Act. The monopoly granted by patent protection, coupled with the unchecked nature of free pricing, determines the exorbitant profits derived from patented drugs in the United States. Pharmaceutical manufacturers emphasize that maintaining high prices is essential to recoup R&D investments and sustain ongoing innovation.
However, pharmaceutical companies have never set drug prices based on the cost of development. The pricing logic in the drug market has always been to extract the maximum willingness-to-pay from the market—namely, setting prices at whatever level consumers are willing to bear.
Since 1990, government health insurance programs, government employee health insurance, and the Veterans Affairs (VA) system have become the largest drug purchasers in the market. As a result, the purchasing prices and policies of Medicare, Medicaid, and the VA have served as benchmarks for commercial insurers.
Government health insurance programs have been entrusted to commercially operated Pharmacy Benefit Managers (PBMs). Driven by considerations such as price negotiation, management costs, and legal risk mitigation, major commercial insurers have also increasingly outsourced their operations to PBMs. In an already complex drug pricing system, PBMs have inserted themselves as intermediaries, monopolizing price negotiations in the U.S. pharmaceutical market. Consequently, PBM involvement has made U.S. drug pricing even more opaque and fraught with irregularities.
This has created a situation where pharmaceutical manufacturers + wholesalers + PBMs = monopoly over drug prices.
② Drug Pricing Terminology
Below is an explanation of several concepts and terms related to drug pricing in the United States*.
Government Maximum Price FUL (Federal Upper Limit): The maximum price limit for pharmacy payments for certain drugs as stipulated by CMS (Centers for Medicare & Medicaid Services) under the 1990 law.
Maximum Allowable Cost (MAC): State-established price ceilings similar to the Federal Upper Limit (FUL).
Pharmacy U&C (Usual and Customary Price): Average retail pharmacy cash price.
Average Wholesale Price (AWP): The estimated wholesale prices published by Medi-Span and First Databank (i.e., the prices that retailers may pay to wholesalers).
Wholesale Acquisition Cost (WAC): The list price at which manufacturers sell to wholesalers, excluding discounts and rebates/refunds (as defined by federal regulations).
Average Manufacturer Price (AMP): The discounted price at which pharmaceutical manufacturers sell directly to wholesalers, GPOs, or pharmacies.
Estimated Acquisition Cost (EAC): The estimated price paid by physicians or hospitals to wholesalers or pharmacies. State Medicaid agencies establish state-specific pricing regulations for certain prescription drugs.
Average Actual Cost (AAC): The procurement price of retail pharmacies estimated based on invoice audits.
Dispensing Fee: Charges for professional pharmacy services and other costs.
*(Excerpted from Pharmacists: Understanding Drug Price by Joey Mattingly, Pharm D, MBA 06, 2012)*
③ Chaotic Drug Pricing
A dizzying array of prices and confusing explanations have left few people clear on what drugs actually cost, how much pharmaceutical manufacturers charge Pharmacy Benefit Managers (PBMs) and wholesalers, or the magnitude of rebates and kickbacks flowing among manufacturers, PBMs, wholesalers, insurers, and pharmacies. The “list price” quoted by manufacturers is merely a “negotiated sticker price,” and the free-pricing model keeps the underlying transactions shrouded in secrecy.
Therefore, many scholars can only make educated guesses and estimate the distribution of profits across various stages of pharmaceutical sales.
Opaque drug rebates and kickbacks are the root cause of the inability to calculate drug prices. In 1990, the Omnibus Budget Reconciliation Act (OBRA) established the “Medicaid Drug Rebate Program,” making pharmaceutical manufacturers’ provision of rebates and kickbacks to buyers a legal practice in U.S. drug sales.
Figure 11 provides a simple analysis of the rebate “game” between Pharmacy Benefit Managers (PBMs) and insurance companies.
Figure 11. Diagram of Rebates Between PBMs and Insurance Companies
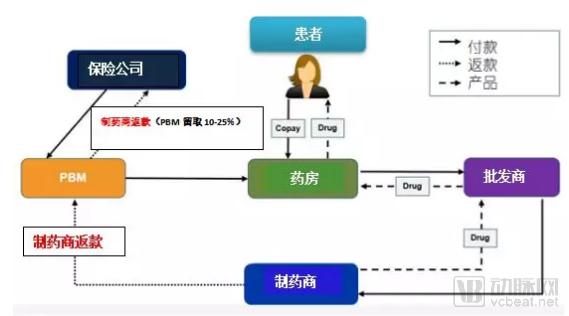
Source: Adapted from “A Primer on Prescription Drug Rebates: Insights into Why Rebates Are a Target for Reducing Prices” by Gabriela Dieguez et al., May 21, 2018
In 2012, Forbes columnist Matthew Herper estimated the rebates for the ten best-selling drugs of that year in his Forbes article “Inside The Secret World Of Drug Company Rebates.”
Table 2. Forbes’ Matthew Herper’s Estimates of Drug Rebates
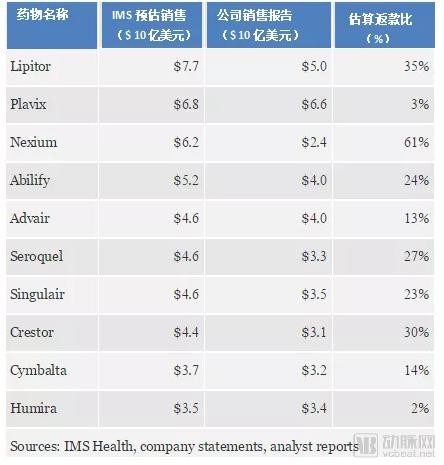
Source: Forbes, Inside The Secret World Of Drug Company Rebates, May 10, 2012
As shown in the table, Lipitor’s rebate rate was 35%, while Nexium’s reached as high as 61%! Are they selling drugs or giving them away? According to reports, U.S. pharmaceutical companies may have spent as much as $40 billion on rebates alone in 2011.
Pricing confusion and variations in state laws result in significant price disparities for the same medication across different pharmacies and locations.
The table below lists the prices of five generic drugs at ten chain pharmacies in the United States.
Table 3. Comparison of U.S. Drug Retail Prices in 2017
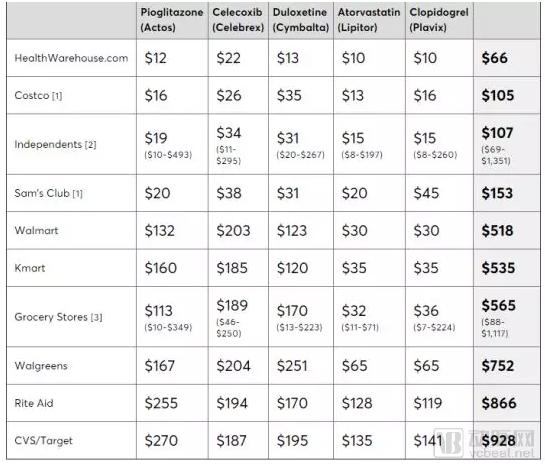
Source: CR’s secret shoppers did—and the price differences were remarkable, By Lisa L. Gill April 05, 2018
What constitutes a reasonable price? Why is this the case? The complexity of drug pricing in the United States has reached a level that no one can fully comprehend. This chaos forces many professionals to rely solely on analyses (and estimates) of the operational performance of listed pharmaceutical manufacturers, pharmacy benefit managers (PBMs), wholesalers, and drug retailers, based on their publicly available financial statements.
The monopolization of the U.S. drug sales market has evolved alongside the commercial development of pharmacy benefit managers (PBMs).
Prior to the implementation of Medicare Part D in 2003, most Pharmacy Benefit Managers (PBMs) focused primarily on prescription claims processing. Following the enactment of Medicare Part D, the covered population and scope of services expanded dramatically. Leveraging advances in computer and internet technologies, PBMs became extensively involved in the formulation of Medicare policies and the administration of Medicare programs, as the government outsourced a substantial volume of operations to them. Recognizing these emerging opportunities, pharmaceutical wholesalers and retailers actively partnered with PBMs to capture a share of government healthcare spending. This led to the formation of horizontal monopolies through alliances among wholesalers, retailers, and PBMs.
As Medicare is the largest healthcare insurance system in the U.S. pharmaceutical market, numerous commercial and social insurance plans across the country benchmark their policies and coverage standards against those of Medicare. Consequently, the U.S. pharmaceutical market rapidly developed a manufacturing monopoly led by patented drugs and a distribution monopoly centered around Pharmacy Benefit Managers (PBMs).
Table 4: Manufacturer Monopoly (2016)
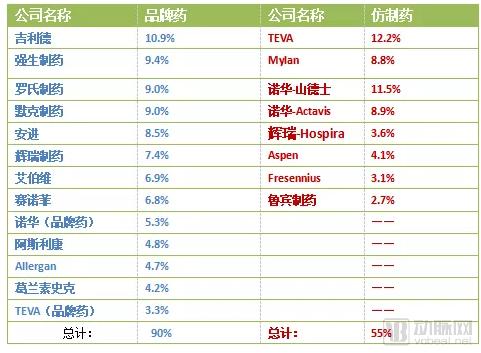
Source: USC Schaeffer, THE FLOW OF MONEY THROUGH THE PHARMACEUTICAL DISTRIBUTION SYSTEM, June 2017
Table 5, Retailer Monopoly (2016)
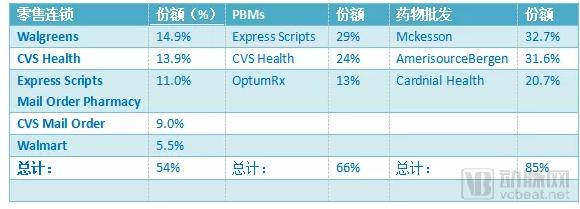
Source: USC Schaeffer, THE FLOW OF MONEY THROUGH THE PHARMACEUTICAL DISTRIBUTION SYSTEM, June 2017
In 2016, major pharmaceutical retail chains began pursuing horizontal mergers with wholesalers and pharmacy benefit managers (PBMs), and even with insurance companies. Walgreens, a leading pharmaceutical retailer, not only merged with wholesale giant AmerisourceBergen and global distributor Alliance Boots to form Walgreens Boots Alliance, but also acquired the PBM subsidiary of Express Scripts, a leading pharmacy benefit management company. As a result, Walgreens, with its network of 9,560 pharmacies, integrated retail, wholesale, and PBM operations under its unified platform.
CVS, which also operates approximately 9,600 pharmacies, merged with Caremark, the largest pharmacy benefit manager (PBM), and subsequently acquired the wholesale giant Cardinal Health. Rite Aid merged with wholesalers McKesson and Celesio. Currently, Walgreens is planning to acquire Rite Aid; however, the U.S. Federal Trade Commission (FTC) and the Department of Justice (DOJ) have not yet approved the transaction due to concerns that it may violate antitrust laws.
At the end of 2018, CVS spent $70 billion to merge with Aetna, a giant in health insurance and healthcare services. Currently, Walgreens, CVS, and Rite Aid monopolize 92% of the U.S. pharmaceutical sales market share.
Figure 12, Monopoly in Generic Drug Procurement
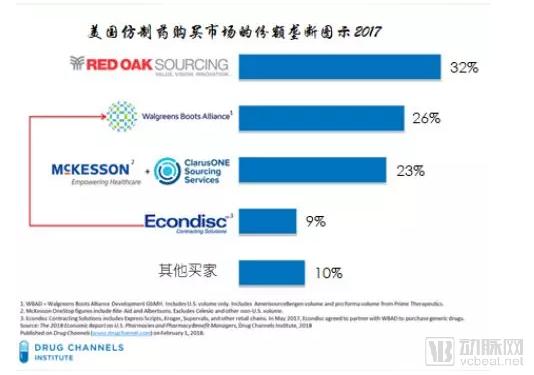
Source: Drug Channels, “Meet The Power Buyers Driving Generic Drug Deflation,” June 27, 2018
In 2017, PBMs, wholesalers, chain retailers, and insurance companies, through various mergers, restructurings, and horizontal business collaborations, enabled just three major purchasers to control 90% of generic drug procurement in the United States.
① Hatch-Waxman Act
Figure 13. Diagram of the Hatch-Waxman Act
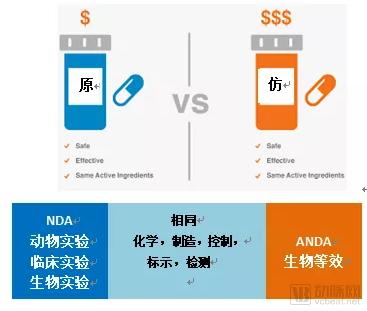
Source: Compiled by the author
The fundamental purpose of the Hatch-Waxman Act is that any generic drug demonstrating bioequivalence and pharmaceutical equivalence to its reference listed drug may be therapeutically substituted for the original brand-name drug.
② Generic Substitution Law
Prior to the 1984 legislative reforms on generic drugs, many states had already enacted laws permitting the substitution of certain generic drugs for brand-name originals in an effort to curb healthcare expenditures; this practice is known in the United States as “Generic Substitution Law.”
Following the Hatch-Waxman Act, and in accordance with Congressional mandates, the FDA regularly publishes Approved Drug Products with Therapeutic Equivalence Evaluations (commonly known as the “Orange Book”), which is based on bioequivalence and pharmaceutical equivalence. The Orange Book lists generic drugs recognized by the FDA as substitutable for brand-name innovator products.
U.S. states rapidly enacted drug product selection laws based on the Orange Book, with each state establishing its own regulations and scope for generic substitution of brand-name drugs.
Hospitals, physicians, pharmacies, health insurers, and payers (such as employers, associations, and funds) in the United States implement corresponding drug substitution in accordance with the Orange Book and state laws. This constitutes the legal and technical basis for generic drugs replacing brand-name originator drugs.
③ Encourage Generic Drug Substitution
In addition to legislation, the United States has implemented numerous commercial policies to promote generic drug substitution, encouraging insurers, physicians, and patients to use generic drugs, and incentivizing distributors to sell them. Specific laws and policies include the Generic Drug Naming Act and the Tiered Reimbursement Policy for Medications under Health Insurance Programs.
In terms of business models, numerous policies and measures have been introduced to encourage patients to use generic drugs, physicians to prescribe them, and pharmacies to dispense them.
Figure 14. Distribution of Sales Profits for $100 Brand-Name and Generic Drugs
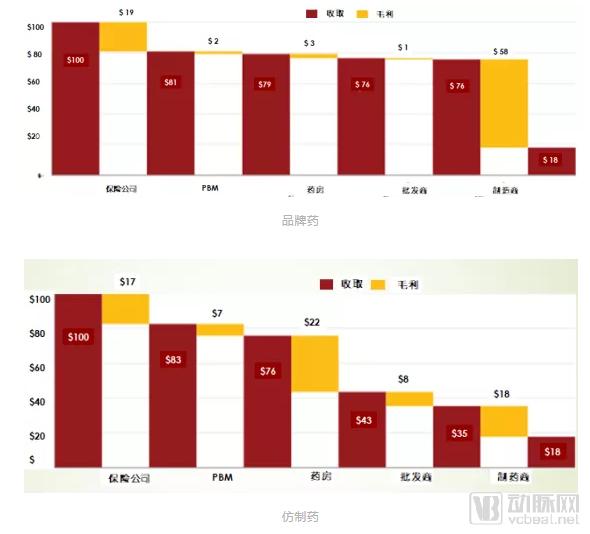
Source: Compiled from THE FLOW OF MONEY THROUGH THE PHARMACEUTICAL DISTRIBUTION SYSTEM, USC Schaeffer, 2018
For every $100 in sales of brand-name drugs, pharmacies retain $3, and the manufacturer’s gross profit is $58; for every $100 in sales of generic drugs, pharmacies retain $22, while the manufacturer’s gross profit is only $18. From wholesalers to PBMs, the gross margins on promoting generic drugs are higher than those on brand-name drugs.
Selling drugs is more profitable than manufacturing them, which may also be a characteristic of the pharmaceutical market!
Figure 15. Comparison of Sales and Gross Profit from Original and Generic Drugs Among the Three Major U.S. Wholesalers in 2009
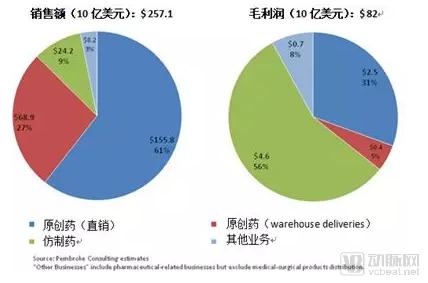
Source: Compiled from The 2010-11 Economic Report on Pharmaceutical Wholesalers 2011
***The three major wholesalers refer to: AmerisourceBergen, Cardinal Health Inc., McKesson Corporation
"Whether for wholesalers or retail pharmacies, selling generic drugs is both simple and highly profitable!"
④ 30 Years of Generic Drug Substitution
In 1990, driven by the U.S. government, a nationwide public education campaign on generic drug substitution was launched. Major pharmacy chains introduced initiatives such as “$5 for a 30-day supply,” “$4 for a 30-day supply,” and “zero-cost generic drug” programs. Coupled with various insurance coverage and reimbursement policies favoring generic drugs, the share of generic prescriptions in the United States rose from less than 19% at the time of the Hatch-Waxman Act’s enactment to nearly 92% by 2017.
Figure 16. Market Share Statistics of Generic and Brand-Name Drugs in the United States, 2009–2017
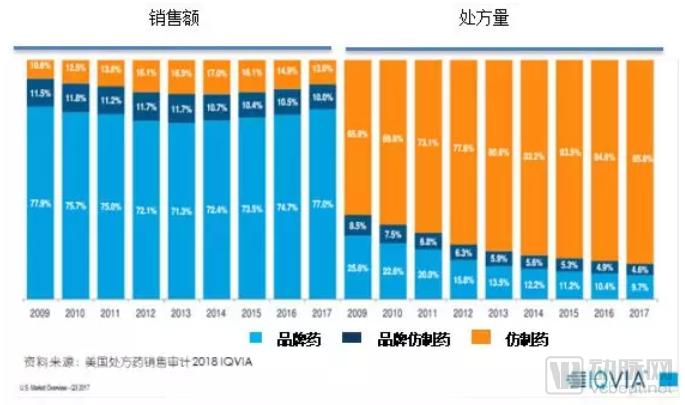
Based on these data, the legislative reforms for generic drugs in the United States have been successful, with generics largely resolving the issue of medication accessibility. According to the Association for Accessible Medicines (AAM), generic drug substitution alone saved consumers and the government $1.67 trillion over the decade from 2007 to 2017.
⑤ Have Generic Drugs Reached Their End?
In 2015, generic drugs accounted for approximately 90% of prescriptions in the United States, rising to 92% by 2018. The market capacity for generics has become saturated, leaving little room for further substitution. Intense competition has rapidly pushed the generic drug industry to a point of unsustainability.
In their article “Analysis of Manufacturing Cost in Pharmaceutical Companies,” Prabir Basu et al. analyzed the manufacturing costs of major U.S. pharmaceutical companies from 1994 to 2006. Based on the data provided by Prabir Basu, this paper presents the manufacturing costs of pharmaceutical enterprises across different sectors in the United States.
Figure 17. Statistics on the Average Manufacturing Costs of Major Pharmaceutical Companies, 1994–2006
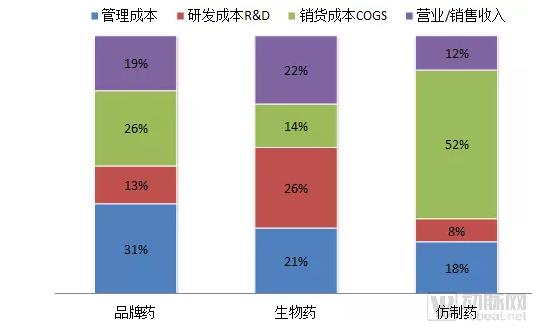
Source: Compiled from data in J Pharm Innov. 2008
As shown in the figure, generic drugs have very low marginal profits. Due to the free pricing policy for pharmaceuticals in the United States, the marginal profits of patented drugs continue to rise, while those of generic drugs that have lost patent protection continue to decline.
Upon taking office in 2017, the new FDA Commissioner immediately approved a staggering 1,027 generic drugs. Since 2013, the U.S. generic drug market has experienced a wave of price reductions. By 2017, the average profit margin for generic drugs had fallen below 5%.
Figure 18. Trend of Generic Drug Price Reductions in the United States, 2014–2017
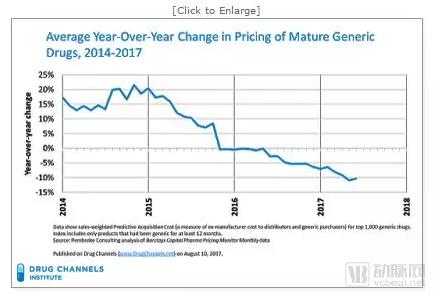
Source: True Cost of Healthcare.org 2017
In 2018, the average price of 90% of generic drug prescriptions in the United States was less than $20, while the average out-of-pocket cost for insured payers was under $6.
Table 9: Prices and Related Statistics of the Top 10 Generic Drugs in the United States in 2017
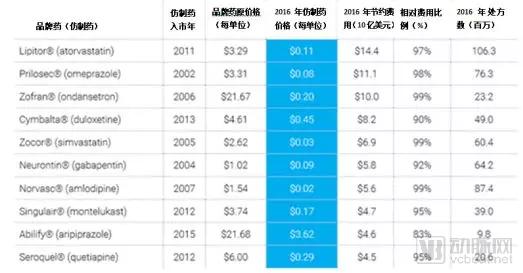
Source: Drug Channels 2018
Since 2003, the three major U.S. generic drug manufacturers—Teva, Mylan, and Watson Pharmaceuticals—have also faced significant challenges!
Figure 19. Changes in Net Profit of the Top Three Generic Drug Manufacturers
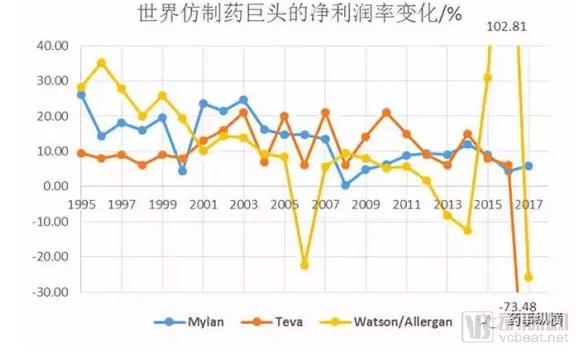
Source: PharmCube 2019
A flood of generic drugs and generic manufacturers has saturated the U.S. market, yet drug shortages remain a frequent occurrence in the United States. Congress and the public continue to urge the FDA to accelerate the approval of generic drugs to bring more products to market. While the FDA is speeding up approvals for generics, it is simultaneously seeking outlets for the country’s excess generic drug production capacity.
In 2018, the FDA proposed the globalization of approval standards for generic drugs, aiming to find a way out for the generic drug industry while also leveraging global resources to address drug shortages in the United States.
In summary, the American public and physicians have embraced the concept of generic drug substitution. However, U.S. government policies encouraging competition have turned the market for relatively simple generics into a “dead sea” of commercial rivalry, leaving most generic drug manufacturers struggling to achieve profitability. Former giants in the generic drug industry are now undergoing transformation, divesting their businesses, or entering the field of innovative drugs.
Leveraging cost advantages and unique technologies, Indian generic drugs have made significant inroads into the U.S. generic drug market, accounting for 42% of the market share by 2017.
The U.S. pharmaceutical market is vast, fiercely competitive, and unforgiving, with many nuances that remain perpetually elusive to outsiders. It is a landscape rife with both “disappointment” and “hope”—challenging to navigate, yet undeniably alluring.
We hope this article provides some useful information for readers interested in the U.S. pharmaceutical market.
Key References:
1,Why Drug Cost So Much? MAY 2017 AARP.ORG/BULLETIN
2,Financing and Distribution of Pharmaceuticals in the United States, Matan C. Dabora, MD, MBA1 et al , 2017 July 4, 2017
3,THE FLOW OF MONEY THROUGH THE PHARMACEUTICAL DISTRIBUTION SYSTEM, USC Schaeffer Center of Health policy and economics, June, 2017
4,Generic Drug Access & Savings in the U.S., AAM 2017
5,Understanding Drug Pricing, PUBLISHED JUNE 20, 2012 by Joey Mattingly, PharmD, MBA
6,Analysis of Manufacturing Cost in Pharmaceutical Companies, J Pharm. Innov. 2008 by Prabir Basu et al.
Note: VCBeat has made edits without altering the author’s original intent. This article represents only the author’s viewpoint.