Editor’s Note: This article is reposted from Xueqiu, authored by Tang Shiyu. Republished with permission by VCBeat.
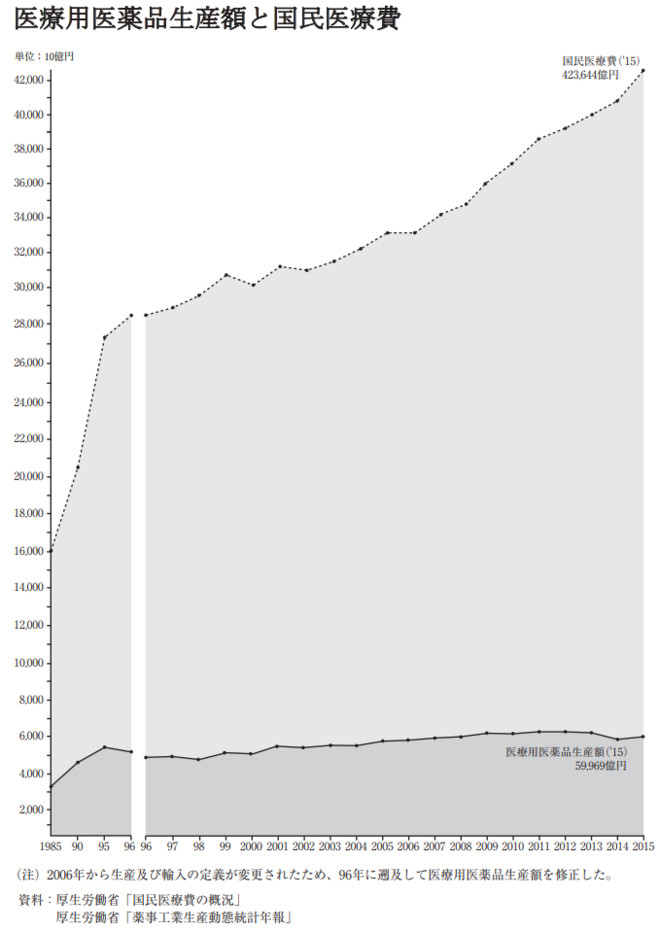
This chart is still quite surprising.,Japan's Aging Crisis Is So Severe,Drug Production Value in Monetary Terms Shows No Growth for 20 Years,and national healthcare expenditure has soared!Given the situation in Japan,“Severe Aging = Pharmaceutical Company Growth”the logic no longer holds。Moreover,,Aging Population Drives Growth in Medication Use,Yet the output value remains stagnant.,Thus, it can only be inferred that there has been a significant drop in price.。
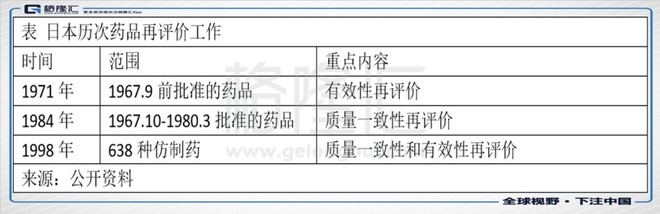
“Consistency Evaluation”Perhaps the Core Factor Driving Price Reductions,Because it was not long after the completion of Japan’s bioequivalence evaluation,The pharmaceutical market is no longer growing:
Indeed, prices have been continuously decreasing.:
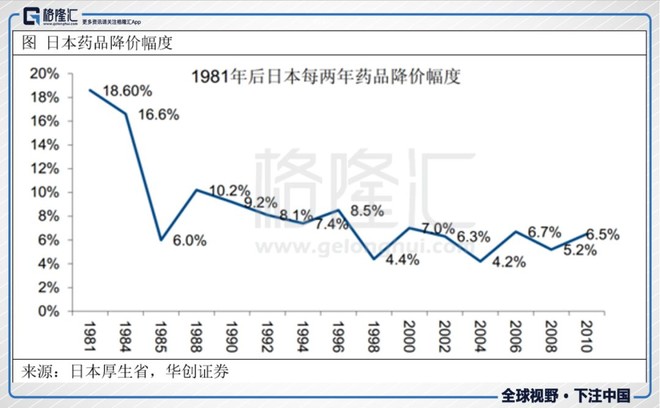
@Care Label Indicates:“To put it bluntly, the reason is,Among all players, pharmaceutical companies are the easiest to bully; in Japan, healthcare is subject to entirely government-mandated pricing.,Prices are revised biennially.(It’s essentially price negotiation.)。This wrangling was presided over by the Central Social Insurance Medical Council.,Abbreviated as TCM Association。Following the submission of recommendations by the Traditional Chinese Medicine Association, the government adjusted prices in accordance with these recommendations.。One option the government faces here is,Either offend the voting public(Tax Increase,Or price increase),Either offend doctors with strong political influence(Japan Medical Association,Major Political Donors,Directly Influencing National Policy in Congress),Either pressure pharmaceutical companies to endure it。”
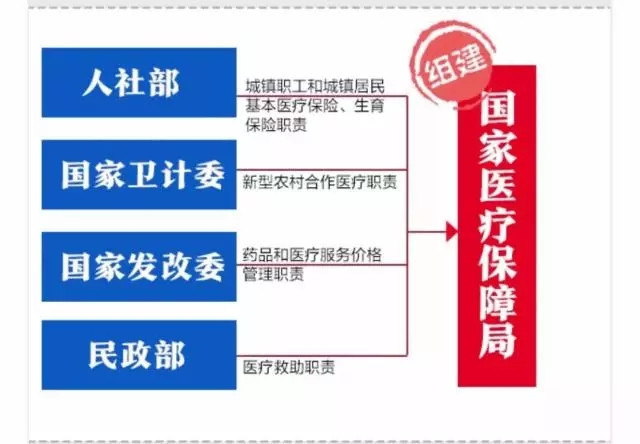
This reminds us of the newly established“Super Healthcare Security Administration”——National Healthcare Security Administration:

Japanese Physicians Are Not to Be Trifled With,"China is indeed easy to provoke.",This gives China one more pushover than Japan.?This way, the burden is not borne solely by pharmaceutical companies.?
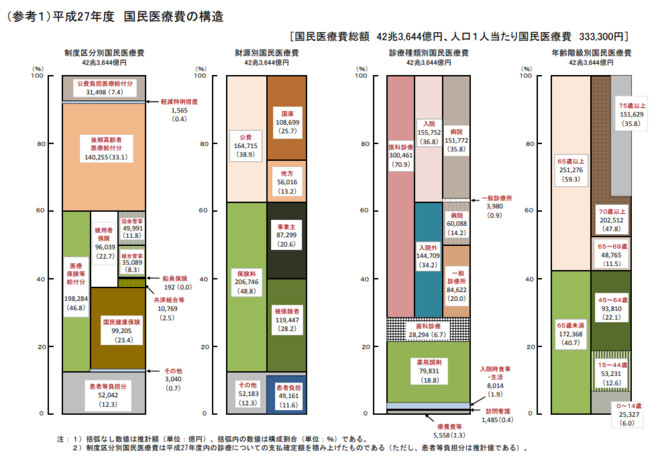
So,Where Does Japan’s National Healthcare Expenditure Come From?,Where Are the Flowers?The Ministry of Health, Labour and Welfare has data.:
This is Heisei 27(Figure from 2015):
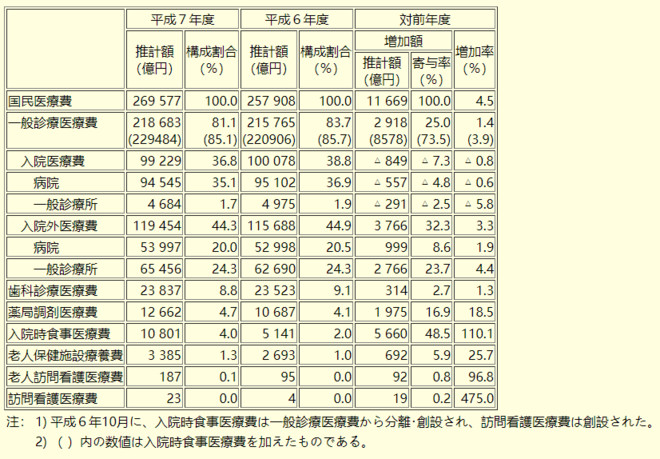
Compare with Heisei 7 (1995)(1995)Heisei 6(1994)ne?
Heisei 7(1995)Medical Expenses by Age:
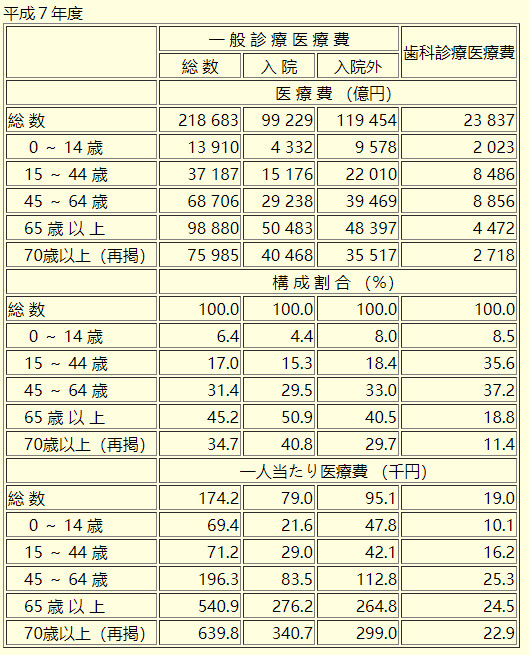
It appears,The money was mainly spent on hospitals.,Moreover, the proportion of spending by individuals aged 65 and older surged from 45.2% in 1995 to 59.3% in 2015.!
What is the current state of Japan's pharmaceutical companies??
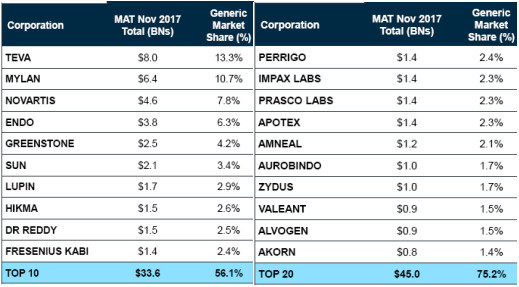
This is the market share:
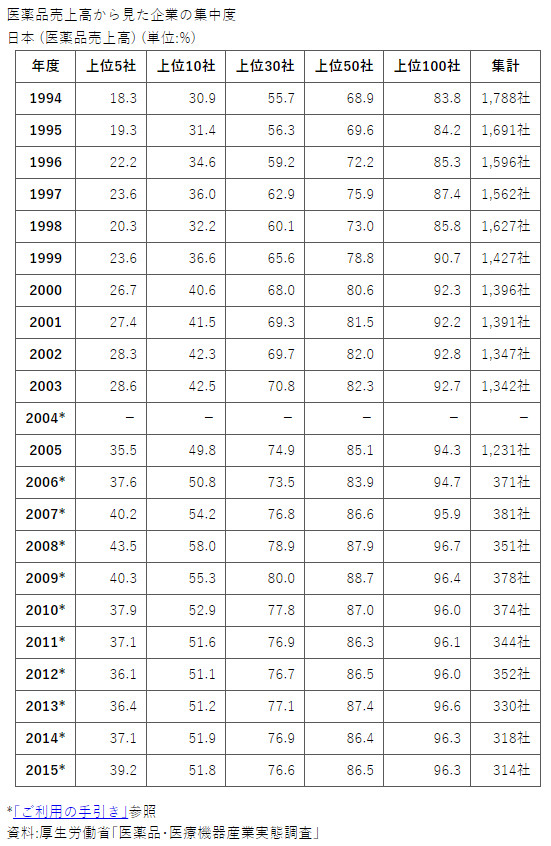
Highly Concentrated。Top 10 Hold 51.8% Market Share,Top 30 Account for 76.6% of Market Share。This is actually similar to the situation of generic drug manufacturers in the United States.,Top 10 account for 56.1%,Top 20 account for 75.2%(Note:It is a generic drug.,Non-patented drug!):
So,Since there is no growth in the domestic market,So, what is the revenue structure of Japanese pharmaceutical companies??
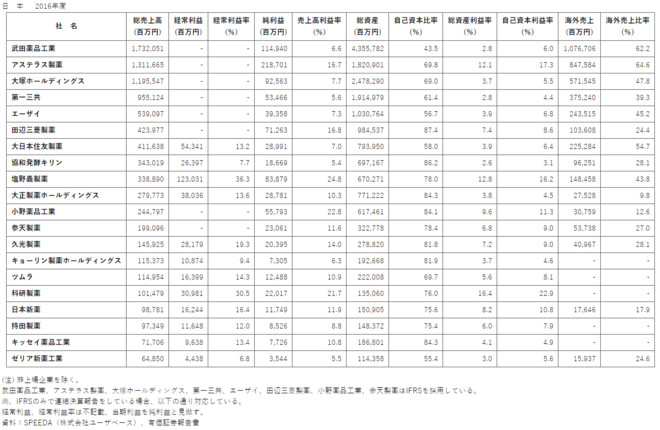
This is from 2016.:
This is from 2013.:
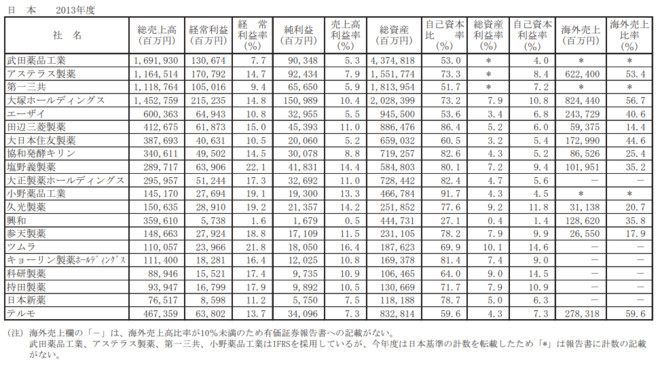
Visible,Major Japanese pharmaceutical companies are expanding into overseas markets.。In 2016, Takeda’s overseas revenue accounted for 62.2% of its total revenue.,Astellas accounts for 64.6%.(53.4% in 2013)。
Then,What Lessons Can China Draw from Japan’s Experience??
Estimated,China’s Healthcare Reform Direction May Draw Lessons from Japan,rather than the United States。
This is a chart showing the proportion of U.S. healthcare expenditure to GDP.:
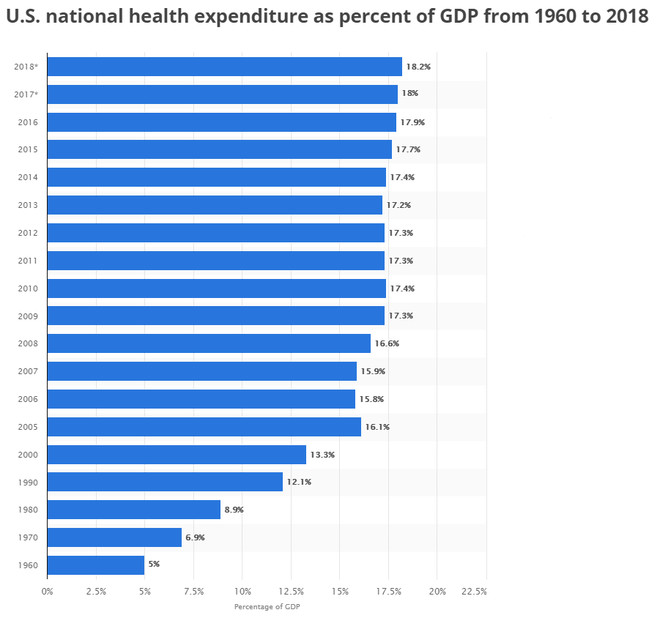
The U.S. GDP Ranks First Globally,However, its healthcare expenditure in 2016 accounted for a staggering 17.9% of GDP.,Moreover, it is projected to grow to 18.2% in 2018.,It may even surpass 20% in the future.!Meanwhile, the degree of population aging in the United States is far lower than that in Japan.。But what about the actual effectiveness??In 2015, the life expectancy at birth in the United States was 78.74 years.。
What about Japan??This is a data chart from the Ministry of Health, Labour and Welfare.,Heisei 27 is 2015.,National healthcare expenditure accounts for 7.96% of GDP.,As is well known,,Japan's aging population is extremely severe.:
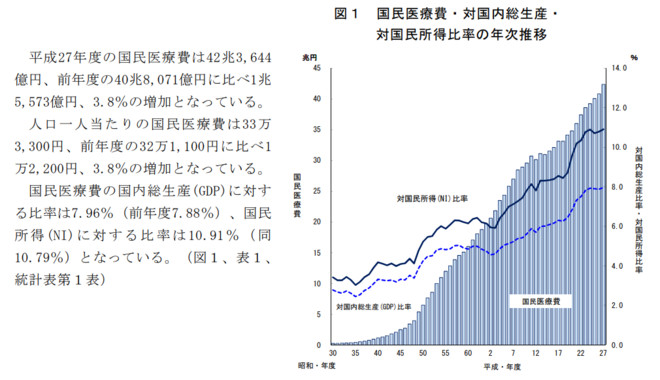
Thus, it can be seen that,Japan Has Achieved Considerable Success in Controlling Healthcare Expenditures!Moreover,,In 2015, the average life expectancy in Japan was 83.84 years.。From the perspective of life expectancy per capita,Americans spent 17.9% of GDP,But it is still not as successful as Japan, which spends only 7.96% of its GDP.。
What about the situation in China??As shown in the figure below:
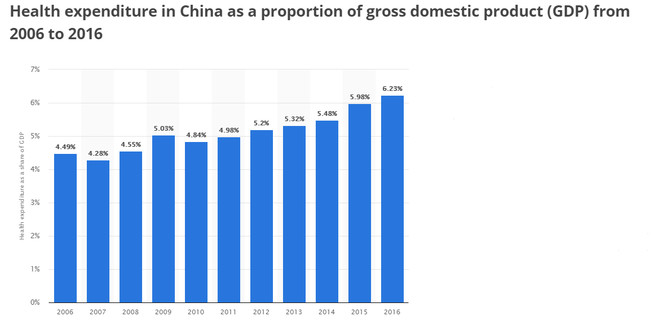
In 2016, healthcare expenditure accounted for 6.23% of GDP.。In 2015, the average life expectancy in China was 75.99 years.,Fairly good——China’s Aging Crisis Will Be Far More Severe Than That of the United States,More similar to Japan。Japan, Amidst Its Severe Aging Population Crisis,Control over healthcare expenditures remains quite successful.,Moreover, the efficacy is quite satisfactory.,So,Should China follow the U.S. model or the Japanese model??
Some people often feel,China Can Learn from the United States,But has the United States done well??Especially when compared with Japan。Moreover,,Where Does the Money Come From??Which department is willing to allocate funds for medical expenditures??Nearly 20% of GDP is no small figure.!