Series IV: International Experiences in DRG Payment System Development – DRG Grouping Methodologies
DRG is a method that applies the principles of statistical control theory to classify inpatients. Based on discharge records, it uses ICD-10 diagnosis and procedure codes, taking into account factors such as the primary diagnosis at discharge, surgical procedures, age, gender, comorbidities or complications, discharge status, and length of stay. By employing clustering methods, patients with similar clinical characteristics, hospital stays, and medical resource consumption are grouped into the same Diagnosis-Related Group (DRG). This system assigns specific codes to each group and establishes corresponding reimbursement standards.
Columnist: Dr. Liu Zhichen, a senior DRG expert and postdoctoral fellow in Public Administration at Fudan University

Professional Profile: Postdoctoral Fellow at the Postdoctoral Mobile Station in Public Administration, Fudan University, and the Postdoctoral Workstation of the Statistical Information Center, National Health and Family Planning Commission. Senior Strategic Expert in the Big Health sector. With nearly a decade of strategic consulting experience in internet healthcare and the broader health industry, previously served as Director of Strategic Consulting and R&D Business Development at a listed domestic IT solutions and services provider. Spearheaded the planning of numerous forward-looking innovative business models for the Big Health sector. Accurately predicted that healthcare payment reforms in China, particularly the adoption of Diagnosis-Related Groups (DRG), would become a key initiative in deepening healthcare reform during the 13th Five-Year Plan period. Served as the overall project lead for a pilot DRG-based medical insurance payment reform project at the municipal level in China. Assisted the municipal Medical Insurance Bureau in designing the top-level framework for citywide DRG payment system reform and facilitated the implementation of supporting information technology systems.
The grouping logic of Diagnosis-Related Groups (DRG) in various countries largely follows the approach established by the US DRG system. Classification is structured across four levels. The first level involves the division into Major Diagnostic Categories (MDC), primarily based on clinical body systems. The second level pertains to the partition by treatment modality, generally categorized into surgical and medical cases; most countries further subdivide surgical cases by anatomical region. The third level consists of Base DRGs (or Adjacent DRGs), where principal diagnoses and principal procedures are assigned to specific base groups according to disease severity and the complexity of treatment. The fourth level involves subdivision into finer DRG groups based on additional factors such as comorbidities, patient age, and discharge status within each base group. In countries that have independently developed their own DRG systems, such as the United Kingdom and Poland, adjustments have been made to the grouping logic by placing the classification by treatment modality before the assignment to Major Diagnostic Categories.
As shown in the figure below:
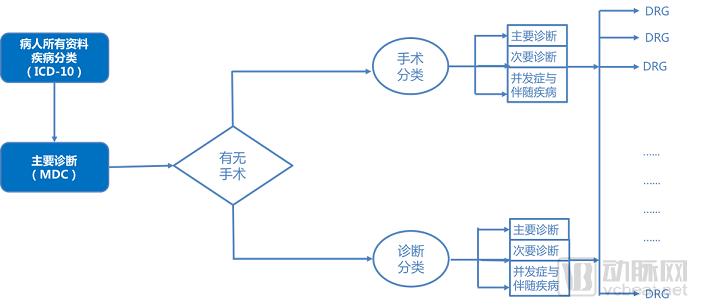
Figure 1 DRG Grouping Process
When countries develop DRG grouping systems, the primary factors considered include clinical factors, management and demographic factors, and resource utilization factors. Among these, clinical factors center on disease diagnosis and subsequent procedures, meaning that classification of diagnoses and subsequent treatments such as surgeries should serve as the most fundamental grouping variables. Most countries adopting the US-Australian DRG system prioritize principal diagnosis as the foremost factor, although definitions of principal diagnosis vary across nations. In contrast, some countries with independently developed DRG systems (such as the United Kingdom and Poland) prioritize procedures over diagnoses.
Grouping Factors | United States MS-DRG | Australia AR-DRG | Germany G-DRG | France GHM | Nordic Countries Nord DRG | United Kingdom HRG | Poland JGP |
Clinical Factors | |||||||
Diagnosis Operation Tumor/Malignant Tumor | √ √ √ | √ √ √ | √ √ √ | √ √ … | √ √ … | √ √ … | √ √ … |
Management/Demographic Factors | |||||||
Admission Type Age Birth Weight Discharge Type Gender Mental Health Classification |
√ √ √ … …
| … √ √ √ … …
| … √ √ √ … √
| … √ √ √ … √
| … √ … √ √ …
| √ √ … √ … …
| √ √ … √ … …
|
Resource Consumption Factors | |||||||
Length of Stay / Day Hospitalization Mechanical Ventilation Environmental Factors Special Ward | … … … …
| √ … … …
| √ √ … …
| √ … … …
| √ … √ …
| √ … … …
| √ … … √
|
Table 1 Consideration of DRG Grouping Factors in Typical Countries
Overall, while DRG grouping systems in various countries each possess their own national characteristics, they all adhere to the following three fundamental principles: first, the collection of data from the front page of medical records serves as the primary basis for DRG grouping; second, DRG grouping must simultaneously account for both clinical similarity and similarity in resource consumption; and third, there must be uniformity in DRG grouping standards and controllability over the number of groups.
DRG grouping is a complex systematic engineering project. In various countries, the grouping systems are established by designated administrative or research departments at the national level, which issue unified standards, and the updating and maintenance work is also centrally managed by the state. It is not appropriate for China to establish multiple sets of DRG groupings for application in different fields; a single, unified grouping system is crucial to ensuring the success of DRG reform.
China’s DRG implementation started relatively late, providing an opportunity to fully learn from and draw on the grouping methodologies that other countries have refined through practice. However, in most countries, a substantial increase in the number of DRG groups occurred only after many years of domestic DRG application. Meanwhile, some countries have encountered operational obstacles due to overly granular grouping. Therefore, during the initial phase of DRG adoption in China, it is essential to adhere to the principle of controlling the number of groups, keeping the total below 1,000. At the same time, as medical record data and cost information continue to improve, the pace of updating and adjusting group definitions should be accelerated to accurately reflect clinical practice.
Adhering to the principles of “unified grouping, unified coding, and unified cost accounting standards,” and fully drawing on the successful experiences of DRG grouping in typical countries, is key to establishing scientifically sound and reasonable DRG grouping results that align with China’s national conditions.
I. Determination of the Principal Diagnosis and Its Impact on DRG Grouping
The principal diagnosis is the most fundamental information for determining DRG grouping and one of the most critical factors in ensuring the effective implementation of DRG-PPS payment. DRG grouping primarily considers the patient’s principal diagnosis; based on the principal diagnosis established by the attending physician, the first step in assigning the patient to a group—namely, the Major Diagnostic Category (MDC)—is determined. An incorrect selection of the principal diagnosis will significantly impact subsequent subgrouping.
Based on international literature, the CN-DRG working group defines the principal diagnosis as the condition (or health status) determined through research to be the primary reason for the patient’s current hospitalization. Generally, this is the diagnosis that poses the greatest threat to the patient’s health, consumes the most medical resources, and results in the longest length of stay during the current admission. The principal diagnosis may include diseases, injuries, poisonings, signs, symptoms, abnormal findings, or other factors affecting health status. A patient can have only one principal diagnosis per hospitalization.
If the principal diagnosis is selected incorrectly, it will directly result in incorrect DRG grouping. Based on data from a special DRG inspection in Beijing, Wei Hehong, Lu Ming, et al. (2015) selected 1,940 medical records with identified issues as study materials. They focused on analyzing the impact of factors such as principal diagnosis, secondary diagnoses, principal procedure, and secondary procedures on DRG grouping. The results revealed that the influence rate of problematic principal diagnoses on grouping (with the impact rate of principal diagnosis errors on DRG grouping being 41.83%) was significantly higher than that of secondary diagnoses, principal procedures, and secondary procedures.
The primary reasons for incorrect principal diagnoses include: errors in disease code selection (such as failure to apply combination codes, miscoding, or overly broad anatomical site specification), inconsistency between the principal diagnosis and the core treatment (as clinicians may sometimes overlook the patient’s primary reason for the current encounter and the main treatment provided), and lack of diagnostic evidence.
Therefore, training for clinicians and coders on the selection of principal diagnoses should be strengthened. It must be clarified that the principal diagnosis is the condition (or health status) determined through study to be the main cause of the patient’s current hospitalization. Generally, the diagnosis that consumed the most medical resources, posed the greatest threat to health, and resulted in the longest length of stay during the current medical encounter should be selected as the principal diagnosis.
II. Determination of Major Surgical Procedures and Their Impact on DRG Grouping
On the basis of correctly selecting the principal diagnosis, emphasis must also be placed on the selection of the principal procedure and operation. This is because, in DRG grouping, different treatment modalities are assigned to different DRG groups. Within the DRG classification system, even with identical diagnoses, patients receiving different treatments will be categorized into distinct DRG groups—namely, surgical groups, procedural groups, and medical management groups. Therefore, when grouping according to relevant treatment modalities, the selection of the principal procedure and operation becomes critically important.
**Definition of Major Surgeries and Procedures**Major surgeries and procedures generally refer to the surgical or procedural interventions performed during a patient’s current hospitalization, specifically targeting the conditions associated with the primary diagnosis established by the attending physician. Based on their purpose, procedures are categorized into diagnostic and therapeutic procedures. Diagnostic procedures are examinations conducted to clarify or confirm a disease diagnosis. Therapeutic procedures are non-surgical interventions aimed at treating diseases. When documenting surgeries and procedures, both diagnostic and therapeutic procedures should be included.
Principles for Selecting Major Surgical Procedures and Interventions:
(1) The selection of the principal surgical procedure or intervention should generally correspond to the principal diagnosis, meaning that the selected principal surgery or procedure is performed specifically for the condition identified in the principal diagnosis.
(2) In cases involving multiple surgeries or procedures during a single hospitalization, the principal surgery or principal procedure is generally the one with the highest risk, greatest technical difficulty, and highest cost.
Depending on the primary surgical procedure or intervention performed, the selection of the principal diagnosis may be affected, thereby influencing DRG grouping. For instance, if a patient undergoes endovascular embolization of an intracranial aneurysm but the reported principal diagnosis is cerebral infarction, whereas the actual condition is a vertebral artery aneurysm, there is a clear discrepancy between the principal diagnosis and the primary surgical procedure.
III. Other Diagnoses and Their Impact on DRG Grouping
Other diagnoses refer to conditions that coexist at the time of admission, develop subsequently, or affect the treatment received and/or the length of stay. Other diagnoses include complications and comorbidities. Complications are conditions causally related to the principal diagnosis and directly caused by it. Comorbidities are other diseases not directly related to the principal diagnosis or complications but which have a certain impact on the current medical care process.
Due to variations in other diagnoses, it is necessary to determine whether a patient presents with major complications or comorbidities (MCC), general complications or comorbidities (CC), or no CC, so as to stratify the severity of the patient’s condition. For the same disease category and treatment modality, factors such as age, the presence of MCC or CC, or the absence of CC will influence the final patient grouping. Therefore, CC and MCC more accurately reflect differences among cases in terms of disease severity, overall treatment plans, physicians’ clinical proficiency, healthcare resource utilization, and prognosis.
If the actual severity of a patient’s condition cannot be accurately reflected through secondary diagnoses during the DRG grouping process, it will inevitably compromise the scientific validity of both DRG classification and weight calculation, and also affect the determination of reimbursement standards for medical expenses under the basic medical insurance fund.
To better differentiate disease severity, the Australian AR-DRGs system employs a modeling approach to assess the severity of all secondary diagnoses documented in each patient’s medical record, in addition to the principal diagnosis. Two successive models have been developed to evaluate the clinical complexity of patient care: the Patient Clinical Complexity Level (PCCL) model and the Extended Clinical Complexity (ECC) model.
IV. Grouping Logic and Validity Assessment of DRG
1. Grouping Logic of DRG
The various international versions of Diagnosis-Related Groups (DRGs) are largely similar in their fundamental grouping logic, primarily following a three-step classification strategy: first, cases are classified by principal diagnosis to form Major Diagnostic Categories (MDCs), characterized mainly by anatomical and physiological systems; second, cases are further subdivided into Adjacent Diagnosis-Related Groups (ADRGs) by comprehensively considering the principal diagnosis and principal procedure; finally, ADRGs are refined into specific DRGs by taking into account other individual patient characteristics, comorbidities, and complications.
The classification process across the aforementioned three steps integrates both clinical expert experience and statistical analysis, with each step employing a distinct methodological focus. The first two steps, namely the mapping from Major Diagnostic Categories (MDCs) to Adjacent Diagnosis-Related Groups (ADRGs), primarily involve clinical specialists from various disciplines categorizing different types of diseases and procedures based on their clinical expertise and in accordance with the principles of “similar clinical processes and comparable resource consumption.” In contrast, the final step, which transitions from ADRGs to Diagnosis-Related Groups (DRGs), mainly relies on statistical analysis to identify classification nodes for further stratification of case types, supplemented by evaluations from clinical experts.
2. Evaluation of the Grouping Validity of DRGs
(1) Evaluation of Intra-group Differences
Internationally, the Coefficient of Variation (CV) is commonly used as a criterion for identifying classification nodes when grouping from All Patient Refined Diagnosis-Related Groups (ADRGs) to Diagnosis-Related Groups (DRGs). The CV is defined as the ratio of a measure of dispersion to a measure of central tendency within a dataset. While measures of dispersion may include the range, mean deviation, or standard deviation, the standard deviation is most frequently used; in this case, the formula is CV = Standard Deviation / Mean. As a statistical metric quantifying the degree of variation among observations within a dataset, a lower CV indicates less intra-group variation and greater homogeneity within each DRG group.
Taking the CN-DRG grouping process as an example, the target variables for selecting the coefficient of variation are inpatient medical expenses or length of stay. The calculation formula is as follows:

Given that medical costs and length of hospital stay mostly follow a skewed distribution, it is common practice to “trim” the data to remove outliers and adjust the distribution before calculating the coefficient of variation. The trimming method employed is the internationally accepted interquartile range (IQR) approach. The formulas are as follows: Lower bound = Q1 − 0.5 × (Q3 − Q1); Upper bound = Q1 + 1.5 × (Q3 − Q1).
Here, Q1 refers to the 25th percentile, and Q3 refers to the 75th percentile. Data points between these upper and lower bounds are included in the calculation of the coefficient of variation, while data points outside these bounds are excluded.
Internationally, whether the coefficient of variation (CV) within a target variable group of a specific DRG is less than 1 serves as an indicator for assessing intra-group homogeneity. A smaller value indicates lower intra-group variability and better intra-group homogeneity. As shown in the figure below:
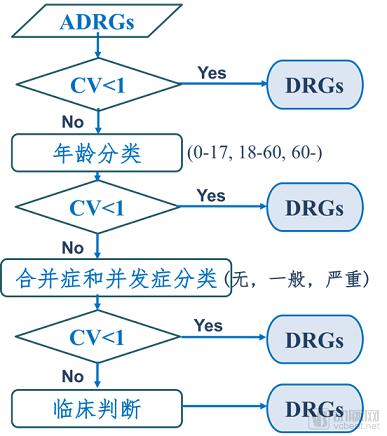
Figure 2 Schematic diagram of the grouping process from ADRG to DRG in CN-DRGs
(2) Evaluation of intergroup differences
The evaluation method for inter-group differences generally assesses the between-group variation of DRG model groupings by calculating the Reduction in Variance (RIV). The formula is as follows:
RIV = (Total Sum of Squared Deviations from the Mean − Sum of Total Sum of Squared Deviations from the Mean for n Subsets) / Total Sum of Squared Deviations from the Mean
RIV reflects inter-group heterogeneity by calculating the ratio of variation between subsets to the total variation after a dataset is decomposed into n (n ≥ 2) subsets. In essence, the RIV value is equivalent to the ratio of between-group variance to total variance. A higher RIV value indicates stronger inter-group heterogeneity and better clustering performance.
(3) Evaluation of the Validity of the Grouping Model
After establishing a DRG model using specific methods, it is necessary to further validate the model. A common approach is to test whether inpatient costs vary significantly across each DRG group. If the P-value of the test is <0.05, it indicates that inpatient costs are not identical across all DRG groups, suggesting that the grouping model is valid. Since inpatient costs generally do not follow a normal distribution, the rank sum test is often used for validation. Alternatively, natural logarithm transformation can be applied to inpatient costs to approximate a normal distribution, followed by analysis of variance (ANOVA).
Furthermore, some scholars have attempted to use ROC curves to evaluate the grouping performance of DRG models. The ROC curve, or receiver operating characteristic curve, is a composite metric that reflects the relationship between sensitivity and specificity as continuous variables. It graphically illustrates the interplay between sensitivity and specificity by plotting sensitivity on the y-axis against specificity on the x-axis. A larger area under the curve indicates higher diagnostic accuracy; however, whether ROC curves can be used to select the optimal model from multiple grouping models remains to be further validated.
Overall, research on DRG grouping models and evaluation methods in China remains at a relatively preliminary stage. Most grouping models are either directly adopted from or improved upon established foreign models. Furthermore, commonly used evaluation methods for DRG models still exhibit certain limitations. There is a need to refine existing evaluation methodologies to develop an approach capable of identifying the optimal model among multiple grouping alternatives.
V. Continuous Optimization and Update Mechanism for DRG Grouping
The foundation of DRG grouping lies in the actual clinical practices and real-world cost incurrence. With advancements in medical science, improvements in clinical diagnostic and therapeutic methods and care models, as well as the emergence of new drugs and technologies, resource consumption in disease diagnosis and treatment continues to evolve. Healthcare service costs also undergo structural changes driven by societal development. Therefore, DRG grouping itself requires continuous dynamic updates and ongoing optimization to accurately reflect real-world clinical practice and resource utilization.
When implementing DRG-based payment systems, countries also establish mechanisms for the continuous optimization and updating of DRG groupings, tailored to their own data characteristics and practical circumstances.
Taking Australia as an example, the country began introducing Diagnosis-Related Groups (DRGs) in 1988 for intra-hospital and inter-hospital evaluations. In 1991, the Australian Case-Mix Clinical Committee (ACCC) was established to coordinate research on case-mix systems. From 1988 to 1993, the federal government invested AUD 29.3 million to support related research, leading to the development of the Australian National DRG (AN-DRG), which features distinct Australian characteristics. In 1992, Version 1.0 of the AN-DRG, comprising 527 DRGs, was developed, and from July 1 of that year, a nationwide DRG-based Prospective Payment System (PPS) was implemented for hospital reimbursement.
Following the promulgation of the first Diagnosis-Related Group (DRG) system in July 1992, Australia’s national DRG classification system has been revised annually. Version AN-DRG 2.0, comprising 530 DRGs, was introduced in 1993; this was followed in 1995 by Version AN-DRG 3.0, which expanded to 667 DRGs. After Australia decided to adopt the International Statistical Classification of Diseases and Related Health Problems (ICD-10) along with new coding procedures, the AN-DRG system underwent extensive revisions. In 1998, AN-DRG was replaced by the more refined Australian Refined Diagnosis-Related Groups (AR-DRG). Since then, AR-DRG has been revised every two years and remains in use to this day.
The development of AR-DRG is an evolving process. It was initiated by the Department of Health and Ageing, in consultation with the Australian Clinical Casemix Committee (Clinical Classification and Coding), the National Centre for Classification in Health, area health services, and other organizations. Each version of the Australian DRG classification system corresponds to a specific ICD coding standard. The 2015 AR-DRG Version 8 introduced significant changes, including the new Enhanced Clinical Complexity (ECC) model, which acknowledges and allows for cost variations within adjacent DRGs.
Germany's G-DRG system has undergone 15 version updates from 2003 to the present, and it is also a system that progressively learns and continuously improves.
References:
1. Wang Xiaowan, Liu Xiaoxian. Principles and Evaluation of the DRGs Method[J]. Foreign Medical Sciences (Section of Social Medicine), 1990, 7(2): 53-56
2. Lang Jingjing, Jiang Qin, Wang Shan, Yu Lihua. Comparative Study and Implications of DRG Grouping in Typical Countries [J]. Chinese Health Economics, 2017, 36(4): 50-53
3. Guo Zhiwei. Principles and Methods of DRGs and Application Strategies in China [J]. Chinese Health Economics, 2010(8): 37-39
4. Jiao Jianjun. Selection of the Principal Diagnosis on the Medical Record Front Sheet[J]. Chinese Journal of Hospital Administration, 2011, (11): 832-834
5. Australian Institute of Health and Welfare. National Health Data Dictionary [M]. 15th ed. Beijing: Standards Press of China, 2010
6. Centers for Medicare & Medicaid Services (CMS) and National Center for Health Statistics (NCHS). Official Guidelines for Coding and Reporting ICD-10-CM [R]. 2011
7. Wei Hehong, Lu Ming, et al. Analysis of the Impact of Diagnostic Selection and Surgical Procedures on DRG Grouping [J]. Chinese Journal of Hospital Administration, 2015, (11): 869-871
8. Li Yang, Shen Yaping, Xia Zhiwei. Introduction to the Australian Clinical Complexity Model (ECC) [R]. The First National Diagnosis-Related Groups (DRG) Forum, 2016: 3-6
9. Palmer G, Reid B, Aisbett C, et al. Evaluating the performance of the Australian National Diagnosis Related Groups.Sydney: The Centre for Hospital Management and Information Systems Research, University of New South Wales,1997
10. Du Jianliang, Liu Junfeng, Chen Qian. Evaluation Methods for Commonly Used DRGs Models [J]. Chinese Medical Record, 2014, 15(8): 36-37
11. Beth R, Stephen S. Comparing diagnosis-related group systems to identify design improvements. Health Policy ,2008,87:82-91
12. George P, Beth R. Evaluation of the performance of diagnosis-related groups and similar case-mix systems: methodological issue[J].Health Services Management Research,2001,14:71-81
13. Zhu Dongzhe, Zhu Liqiang, Shi Fusheng, et al. Study on the DRG Grouping Method for Pediatric Scald Cases[J]. Chinese Medical Record, 2014, 15(1): 36-39
14. Lu Yong. Operational Mechanism and Effectiveness Evaluation of the Australian Diagnosis-Related Groups Prospective Payment System [J]. Chinese Health Resources, 2011(9):343-345
Copyright Statement:
Most of the views expressed in this article are based on Dr. Liu Zhichen’s individual postdoctoral research findings. The cited articles and viewpoints reflect the opinions of their respective authors, obtained from publicly available sources. Unauthorized reproduction, excerpting, copying, mirroring, or any other form of use is strictly prohibited.