Global Drug R&D Pipeline Trends Report: Oncology Accounts for 29% of Late-Stage Pipeline, with Emerging Biotechs Driving Innovation
On April 23, 2019, IQVIA, an integrated provider of information technology and healthcare services, released its annual report, “The Changing Landscape of Research and Development.” The report provides a comprehensive overview of global drugs under development from perspectives such as innovation, drivers of drug growth, and improvements in clinical trial productivity. Artery New Medicine (biobeat1) has compiled and translated the section on clinical drug pipeline development from the report, aiming to explore global R&D trends by analyzing the diseases targeted by global drug pipelines, pipeline progress, companies involved in R&D, and capital investment.
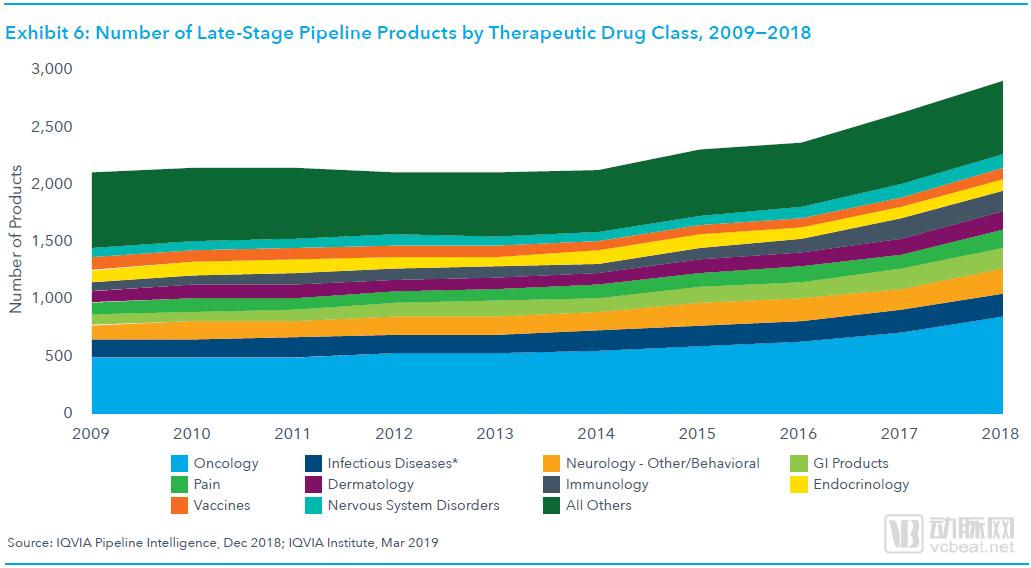
Late-Stage R&D Pipeline by Therapeutic Area, 2009–2018
We define the pipeline entering Phase II clinical trials and beyond as the late-stage clinical pipeline. In 2018, the number of late-stage clinical pipeline assets reached 2,891, representing an 11% increase from 2017 and a 39% increase from 2013, with a compound annual growth rate (CAGR) of approximately 7% from 2013 to 2018.
The late-stage oncology drug pipeline grew by 63% between 2013 and 2018, accounting for 40% of the total growth in late-stage pipelines. By 2018, oncology products represented 29% of the overall late-stage pipeline.
Neurological and other behavioral disorders mainly include spinal muscular atrophy, cognitive impairment, insomnia, and epilepsy. The drug pipelines for these diseases accounted for 8% of the total drug pipelines in 2018. From 2013 to 2018, such drug pipelines grew by 41%, with 33 new drug pipelines added in 2018 alone.
In the field of infectious diseases, research remains highly active despite some pipeline failures between 2017 and 2018. Over the past five years, the late-stage pipeline for infectious disease drugs has grown by 12%, accounting for 7% of the total late-stage pipeline.
The late-stage pipeline for gastrointestinal (GI) drugs has grown by 42% over the past five years, accounting for 6% of the total late-stage pipeline. This growth is primarily driven by an increase in the number of late-stage candidates for nonalcoholic steatohepatitis (NASH). Currently, within the GI late-stage pipeline, there are 32 NASH drug candidates, 12 for Crohn’s disease, and 19 for ulcerative colitis.
The number of analgesics in the late-stage pipeline increased by 52% from 2013 to 2018, including 36 non-narcotic agents, driven by government controls on opioids in the wake of the opioid crisis.
The late-stage pipeline for dermatological diseases has grown by 61% since 2013, with 19 biologics developed for the treatment of psoriasis. These therapies include traditional agents such as glucocorticoids, as well as novel targeted drugs like Humira.
In the late-stage pipeline for neurological diseases, 47% are related to Alzheimer's disease, including both small-molecule drugs and biologics.
Although the number of vaccines in late-stage clinical development has not increased, they still account for a certain share of the total pipeline. The number of vaccines in late-stage development in 2018 decreased by 4% compared with 2013 and was comparable to that in 2017.
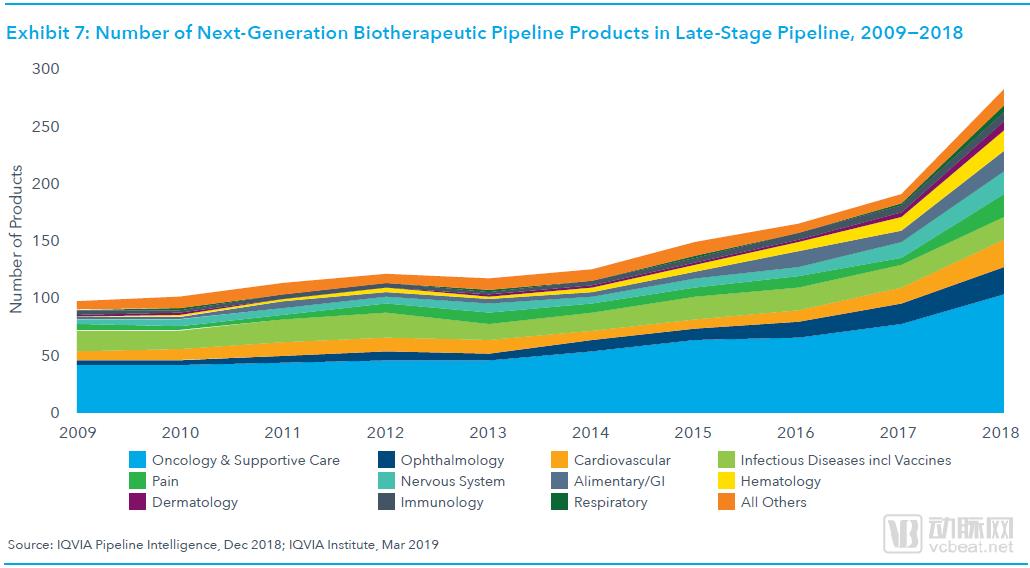
Number of Next-Generation Biologic Therapeutic Pipelines Across Different Disease Areas, 2009–2018
We define next-generation biotherapeutics (NGBs) as cell, gene, and nucleotide therapies. Although NGBs account for only 10% of the late-stage R&D pipeline, they have garnered increasing attention and investment in recent years as a novel approach to disease treatment. The number of candidates in the pipeline more than doubled, rising from 120 in 2015 to 269 by the end of 2018.
The latest developments in NGBs are as follows: nearly 80% of late-stage NGB pipelines are in Phase II clinical trials; three NGBs were launched in 2018, and fewer than 20 NGBs are expected to reach the market.
Analgesic agents encompass a range of gene-targeted therapies, including two RNA interference (RNAi) drugs that have been successfully approved for the treatment of hereditary transthyretin-mediated amyloidosis (hATTR).
Among the 17 next-generation biologics (NGBs) for hematologic diseases, 13 are gene therapies targeting conditions such as hemophilia and thalassemia; two are gene-editing drugs, one of which utilizes CRISPR-Cas9 technology to treat thalassemia and sickle cell anemia.
There are 18 NGBs for neurological disorders such as multiple sclerosis, Parkinson’s disease, amyotrophic lateral sclerosis, Alzheimer’s disease, and other neuromuscular disorders, up from only five in 2009. The NGB pipeline for neurological disorders is primarily focused on Parkinson’s disease, Alzheimer’s disease, and spinal muscular atrophy.
In 2018, there were 98 NGBs in the oncology field, followed by 23 in ophthalmology. Following the successful market launch of Luxturna, the first gene therapy drug for ophthalmic indications, global pharmaceutical companies have accelerated their R&D efforts on NGBs for the treatment of retinitis pigmentosa and color blindness.
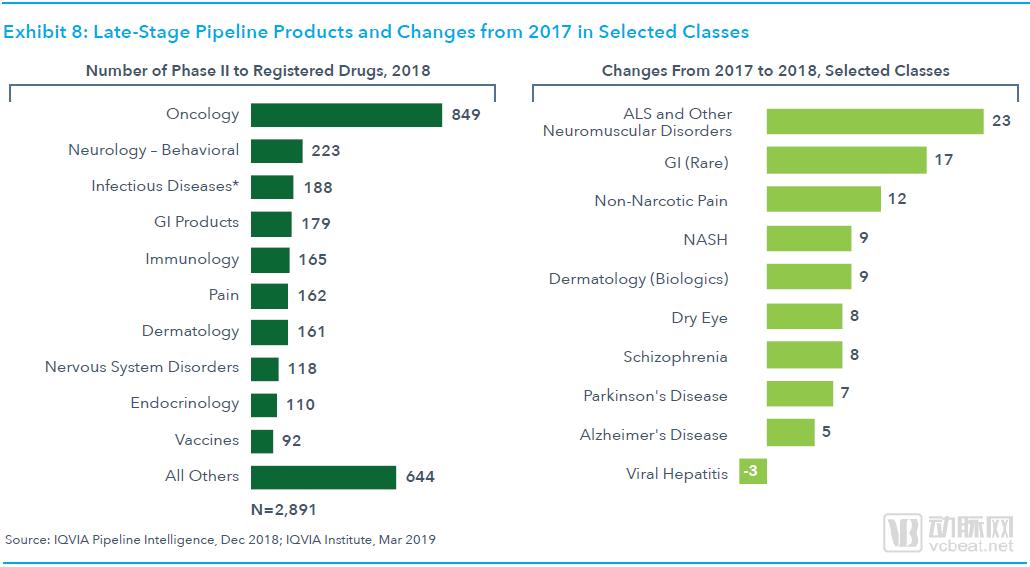
Trends in the Number of Late-Stage R&D Pipelines in Specific Disease Areas Since 2017
In 2018, there were a total of 2,891 drugs in late-stage clinical development, with oncology drugs being the most numerous at 849, an increase of 138 from 2017.
The neurology drug pipeline primarily covers diseases related to behavioral health, including the treatment of depression, psychiatric disorders, attention-deficit/hyperactivity disorder (ADHD), substance abuse, and drug dependence. This portfolio also highlights the addiction crisis caused by opioids.
In 2018, only nine non-opioid analgesics were added. This was largely due to government regulations on opioids.
There are 23 neuromuscular drugs, including 7 for amyotrophic lateral sclerosis (ALS) and 4 for Huntington’s disease.
Despite strong market demand for novel antibiotics and antiviral drugs, the infectious disease drug pipeline in 2018 declined compared to 2017.
The GI pipeline encompasses both conventional medications, such as anti-ulcer drugs, and orphan drugs for rare diseases. The number of therapies targeting specific indications, such as non-alcoholic steatohepatitis (NASH), continues to grow steadily. In 2018, 18% of the GI pipeline was related to NASH, a slight increase from 14% in 2017. The NASH pipeline also reflects the ongoing supply shortage of effective treatments. Potential therapeutic approaches for NASH include pharmacological interventions, stem cell therapy, and RNA interference (RNAi) therapy.
The dermatology pipeline is expanding and becoming increasingly focused on specific diseases. In 2018, there were 14 biologics in the dermatology pipeline, twice the number in 2017, and the pipeline also included biosimilars.
The number of investigational pipelines for viral hepatitis has decreased, possibly due to the recent partial market launch of such drugs.
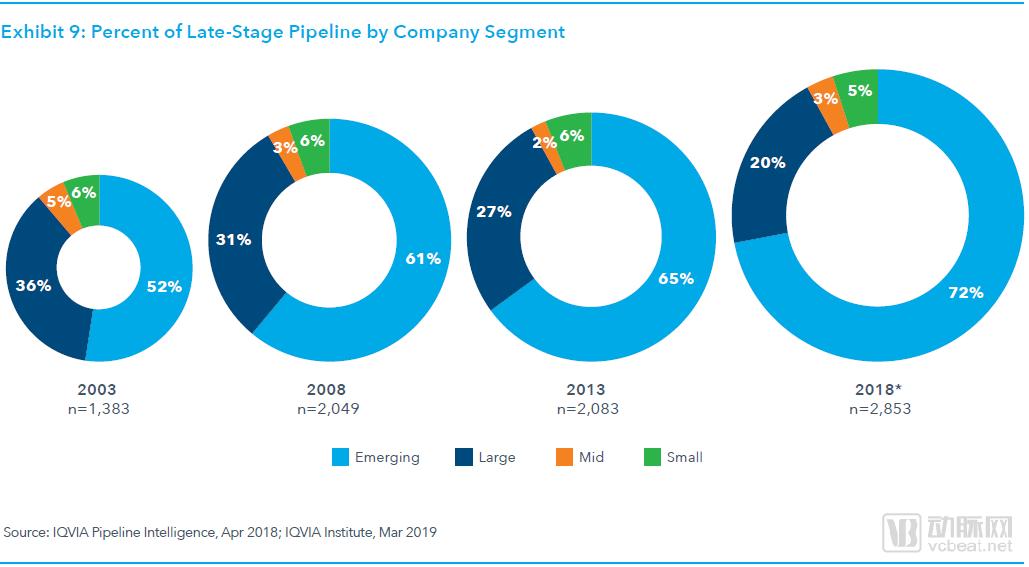
Percentage of Late-Stage Pipeline by Company Size
IQVIA initially categorized pharmaceutical companies into large pharmaceutical companies, mid-sized pharmaceutical companies, small pharmaceutical companies, and emerging biopharmaceutical companies. Large pharmaceutical companies are defined as those with annual sales exceeding $10 billion, while emerging biopharmaceutical companies refer to biopharmaceutical firms that invest less than $200 million annually in R&D and generate less than $500 million in revenue.
The proportion of R&D pipelines held by emerging biopharmaceutical companies rose from 61% in 2008 to 72% in 2018. Over the past decade, the vigorous development of biotechnology has spurred the emergence of numerous new biopharmaceutical companies, with many novel drugs advancing into clinical trials.
The displaced share corresponds to the R&D pipelines of large pharmaceutical companies, which declined from 31% to 20% of the total over a ten-year period.
The growth of the emerging biopharmaceutical sector is driven by smaller, newly established biopharma companies, with oncology and orphan drugs representing the fastest-growing therapeutic areas where these firms are most active. Moreover, they are increasingly less reliant on partnerships or acquisitions to develop their innovative therapies. Although a significant portion of assets held by emerging biopharma companies are sold or licensed out prior to product launch, 47% of new drugs launched in the United States in 2018 were originated by such companies. Since 2013, the absolute number of drugs in the development pipelines of emerging biopharma companies has increased by 37%, making it reasonable to predict that the number of marketed drugs from these companies will continue to grow steadily over the next five years.
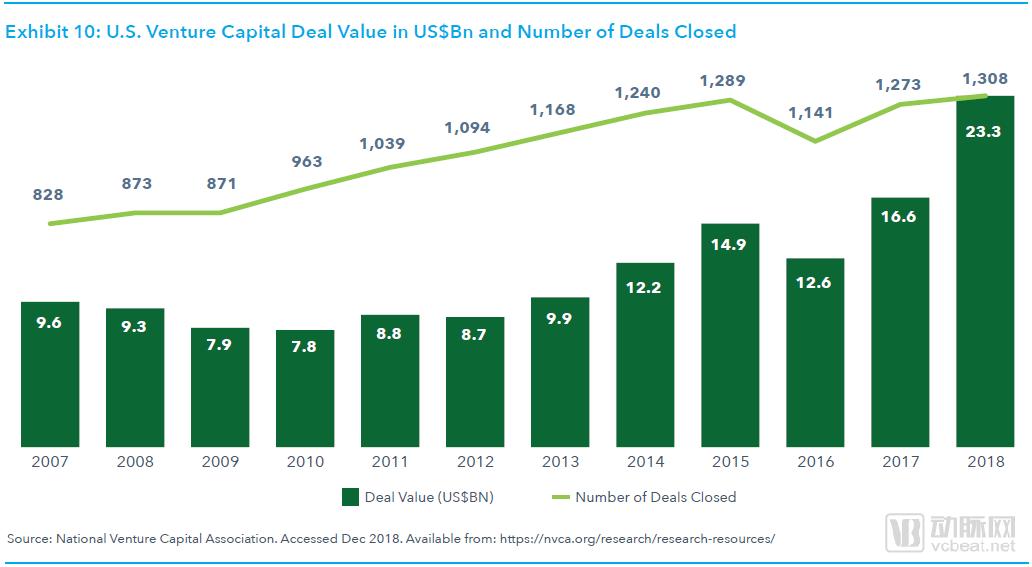
U.S. Venture Capital Deal Value (in Billions of USD) and Deal Count
In 2018, the United States completed 1,308 life sciences venture capital deals, with a total value exceeding $23 billion. Venture capital investment in the life sciences sector has surged over the past five years, registering a compound annual growth rate (CAGR) of 19%.
These investments in medical innovation are expanding into a broader range of disease areas.
Since 2007, venture capital deals have been steadily growing. In 2016, venture capital investment declined, partly due to the uncertainty surrounding the U.S. presidential election. Despite the drop in 2016, the number of deals has gradually rebounded since then, rising by 15% in 2018 to reach a peak, with the total transaction value in 2018 doubling that of 2016.
The growth in 2018 was partly driven by strong momentum in public market offerings, with seven of the ten largest IPOs in the fourth quarter coming from the healthcare sector.
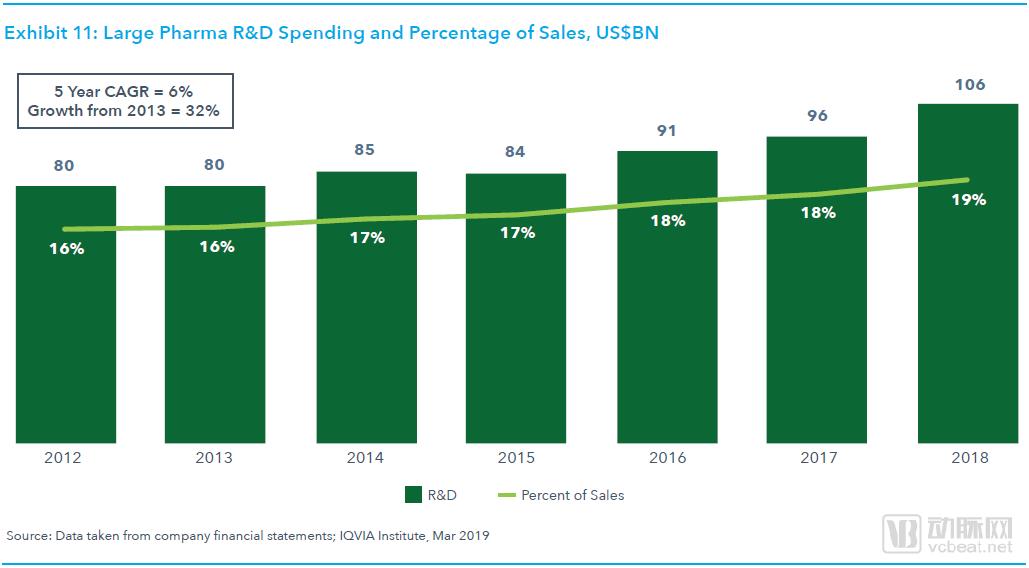
R&D Expenditure and Sales Revenue of Large Pharmaceutical Companies as a Percentage (Unit: Billion USD)
In 2018, the R&D expenditures of the world’s 15 largest pharmaceutical companies surpassed $100 billion for the first time, representing a 32% increase over the previous five years. The total spending reported by large pharmaceutical companies increased substantially from 2013 to 2018, with a five-year compound annual growth rate (CAGR) of 6%.
During the same period, the proportion of R&D expenditure to sales revenue for large pharmaceutical companies increased. In 2018, R&D accounted for 19% of total sales, up from 16% in 2013.