YiCan Releases the '2022 Annual Equity Incentive Report for Biopharmaceutical Companies on STAR Market'

As a sector dedicated to technological innovation enterprises that align with national strategies, achieve breakthroughs in key core technologies, and enjoy high market recognition, the STAR Market prioritizes support for high-tech and strategic emerging industries such as next-generation information technology, high-end equipment, new materials, new energy, energy conservation and environmental protection, and biomedicine. These industries are typically technology-, capital-, and talent-intensive, characterized by a heavy reliance on specialized expertise and core personnel.
The biopharmaceutical industry is a strategic sector vital to national welfare and people’s livelihoods. As one of the most dynamic areas for innovation, it relies heavily on talent. In January 2022, nine ministries and commissions, including the Ministry of Industry and Information Technology, the National Development and Reform Commission, the National Health Commission, the National Healthcare Security Administration, and the National Medical Products Administration, jointly issued the “14th Five-Year Plan” for the Pharmaceutical Industry. The document points out that, in light of the profound impact of the COVID-19 pandemic and the comprehensive deepening of healthcare system reforms, the pharmaceutical industry urgently needs to accelerate its transformation during this new stage of development by shifting toward an innovation-driven model. Product innovation and technological breakthroughs will be the core drivers of future growth in the biopharmaceutical industry.
In the pharmaceutical manufacturing sector, the domestic market was previously dominated by generic drugs. In recent years, Chinese policies have encouraged a shift from generics to innovative drugs, driving industrial upgrading. In the medical device sector, against the backdrop of an aging population in China and policy support for the localization and innovation of high-end medical devices, the industry has entered a phase of rapid development. Furthermore, the pandemic has had a sustained and profound impact globally; numerous Chinese-made COVID-19 diagnostic reagents have been exported overseas, contributing to the rapid growth of the in vitro diagnostics industry.
As a key representative sector within the STAR Market’s industrial focus, the biopharmaceutical industry has benefited from policy incentives such as the “Fifth Listing Standard,” which permits pre-revenue biopharmaceutical companies to go public, thereby facilitating their access to the secondary market. Meanwhile, given that biopharma is a quintessential talent-intensive industry, an increasing number of companies are introducing equity incentive plans to compete for top talent.
In this report, VBInsight analyzes 51 listed companies in the biopharmaceutical sector on the STAR Market that have issued equity incentive plans since the market’s launch, along with all 56 such plans. This analysis outlines the profile of equity incentives among STAR Market-listed biopharmaceutical companies, providing practical reference for the implementation of equity incentive mechanisms in the biopharmaceutical industry.
Note: The data in this report are sourced from the equity incentive plan drafts and 2021 annual reports disclosed by companies on the official website of the Shanghai Stock Exchange, with reference to the sector classification standards of Wind and East Money.
Macro-Characteristic Analysis of the Biopharmaceutical Industry on the STAR Market
I. Technology-Driven Industries Have a Greater Need for Long-Term Incentives
The biopharmaceutical industry is a typical technology- and talent-intensive sector, characterized by long R&D cycles, high technical barriers, and extended periods for talent development. It relies heavily on core technical personnel, necessitating the use of long-term incentive mechanisms to attract and retain talent. In practice, biopharmaceutical companies typically incorporate equity incentives into their compensation systems at an early stage of development and continue to utilize equity incentives as a standardized motivational tool throughout their ongoing growth.
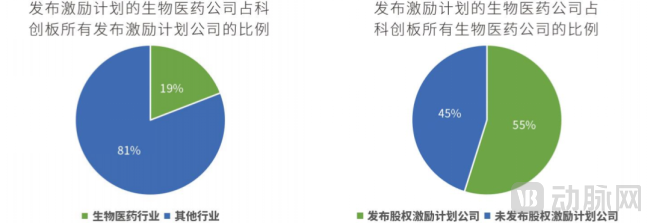
As of April 2022, a total of 293 equity incentive plans had been launched on the STAR Market, among which 56 were in the biopharmaceutical sector, accounting for 19.1%. Meanwhile, there were 93 biopharmaceutical companies listed on the STAR Market, with 51 of them having released incentive plans, representing 54.8%.
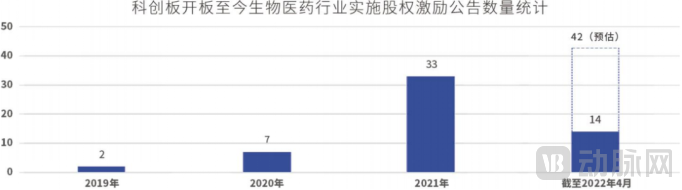
In terms of the number of announcements over the years, the biopharmaceutical industry launched 2 equity incentive plans in 2019, 7 in 2020, and 33 in 2021, showing explosive growth. In the first four months of 2022 alone, 14 equity incentive plans were already introduced, with the annual announcement volume expected to reach a new high.
Core technology constitutes the core competitiveness of biopharmaceutical companies, and this technology relies heavily on key talent. The most direct manifestation of this dependence is that the departure of key personnel can significantly impact a company’s stock price and R&D progress. In recent years, frequent turnover among senior executives at companies listed on the STAR Market reflects the severe scarcity of core technical talent in the biopharmaceutical sector. To compete for talent, pharmaceutical companies have increasingly offered compensation packages with a substantial proportion of equity incentives. Talent is willing to accept such “performance-based bets,” aiming to secure greater rewards by driving breakthroughs within the company and thereby boosting its stock price.
Meanwhile, as an industry that requires long-term capital investment and has a relatively delayed profitability cycle, many biopharmaceutical companies struggle to provide high-level, cash-stable core R&D teams and attract top-tier talent. The 2021 annual reports show that the average R&D expenditure of the 93 biopharmaceutical companies listed on the STAR Market reached RMB 278 million, while the 88 annual reports disclosing employee compensation revealed an average total employee compensation of RMB 79.83 million. Equity incentive plans can not only effectively supplement employee compensation but also alleviate the pressure of labor costs on corporate cash flow.
Consequently, biopharmaceutical companies listed on the STAR Market have been rolling out equity incentive plans in succession. Among the 51 companies that have announced such plans, 46 have disclosed their first-phase incentive plans, four have unveiled their second-phase plans—namely Chipscreen Biosciences, Xiangsheng Medical, Medicilon, and Labpilot—and one company, Pumen Technology, has released its third-phase incentive plan.
In terms of launch timing, 78.5% of companies introduced incentive plans within two years after their IPO. Among them, 11 companies (21.6%) launched incentive plans in the first year post-IPO, 29 companies (56.9%) in the second year, 10 companies (19.6%) in the third year, and only one company (2%) in the fourth year.

II. The longer the R&D cycle, the greater the incentive intensity
From the perspective of establishment dates, the 51 biopharmaceutical companies that launched equity incentive plans had an average operating history of 17.4 years. Among them, Frontier Biotechnologies was the youngest, having been established for 9 years, while Aohua Endoscopy was the oldest, with a 28-year history. Most of these companies underwent extensive development before going public.
From the perspective of sub-sectors, biopharmaceutical companies that have launched incentive plans are mainly distributed across the two major fields of "Pharmaceutical Manufacturing" and "Medical Devices." Among them, the Medical Devices sector launched 27 incentive plans, accounting for 48.2%; the Pharmaceutical Manufacturing sector launched 26 incentive plans, accounting for 46.4%; and the Healthcare Services sector launched 3 incentive plans, accounting for 5.4%.

However, both the total value of incentives and the proportion of incentivized personnel in the pharmaceutical manufacturing sector are higher than those in the medical device sector.
Data shows that the average total incentive value in the pharmaceutical manufacturing sector was RMB 165 million, with Junshi Biosciences having the highest incentive value at approximately RMB 2 billion. In the medical device sector, the average total incentive value was RMB 86.83 million, with Pumen Technology having the highest incentive value; its second equity incentive plan had a total incentive value of RMB 336 million.
In terms of the number of incentivized employees, the average proportion of incentivized personnel relative to total headcount was 26.6% for pharmaceutical manufacturing companies, compared with 18% for medical device companies, indicating that incentive plans in the pharmaceutical manufacturing sector have broader coverage.
This is because the pharmaceutical manufacturing sector is characterized by lengthy R&D cycles; it often takes more than a decade, or even longer, for a new drug to progress from initial development through regulatory approval to market launch. This necessitates long-term commitment from talent, prompting pharmaceutical manufacturers to adopt long-term incentive mechanisms to enhance the stability and cohesion of their core teams. This trend is directly reflected in the frequent implementation of equity incentive plans and the establishment of extended vesting periods.
For example, “Pumen Technology” set an 8-year vesting period in its first equity incentive plan, while “MicroPort Endovascular” also established a 7-year vesting period, with lock-up release commencing only in the sixth year.
Specific Data Analysis of the Biopharmaceutical Industry on the STAR Market
I. Class II Restricted Shares as a Mandatory Incentive Instrument
Class II restricted stock refers to an incentive instrument that sets conditions for beneficiaries to gain benefits in stages, with shares registered in batches upon meeting each set of benefit conditions. Compared to Class I restricted stock, which requires payment at the time of grant, Class II restricted stock allows payment only upon vesting, thereby alleviating the financial burden on employees and aligning with the long R&D cycles characteristic of the pharmaceutical industry.
Among the 56 incentive plans launched in the biopharmaceutical industry, 54 adopted Class II restricted stock as the incentive instrument, while only the last two phases of “Pumen Technology”’s incentive plans utilized stock options.
II. The focus of incentives is on directors, senior executives, and core technical personnel, with an average granted value of RMB 2.68 million per person
Among the 56 incentive plans, the recipients are primarily divided into two categories: the first category comprises “directors, senior executives, and core technical personnel,” while the second category includes “other personnel deemed by the Board of Directors to require incentives,” mainly consisting of key business and technical staff, management personnel, and high-potential employees, thereby targeting both core talent and a larger proportion of the backbone workforce.
Data shows that “directors/executives/core technical personnel” received the highest average grant value, with an average of RMB 2.68 million and a median of RMB 1.75 million. The company with the highest per-capita incentive value was “Junshi Biosciences,” where the 12 directors/executives/core technical personnel received an average grant value as high as RMB 34.96 million. For “other personnel deemed by the Board of Directors to require incentives,” the average grant value was RMB 490,000, with a median of RMB 385,000.
In terms of incentive value, with “directors/executives/core technical personnel” as the focus of incentives, the average grant value per person is 5.5 times that of “other personnel deemed by the Board to require incentives,” highlighting the biopharmaceutical industry’s reliance on core talent.
III. Incentive recipients account for 22% of the total workforce, with broader coverage in the pharmaceutical manufacturing sector
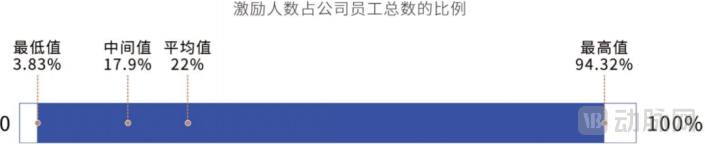
Among the 56 incentive plans, the average proportion of employees participating in the incentives relative to the total number of company employees was 22%, with a median of 17.9%. The company with the broadest incentive coverage was “Chipscreen Biosciences,” where the second phase of its equity incentive plan covered 631 individuals, accounting for 94.32% of its workforce. The company with the narrowest incentive coverage was “Medicilon,” whose first phase of equity incentive plan included a total of 63 participants, representing 3.83% of its employees.
In terms of specific numbers, the average number of individuals receiving incentives was 180, with a median of 107. Among them, “Junshi Biosciences” had the highest number of incentive recipients at 2,004, while “Huaheng Biotechnology” had the lowest at 30.

Twenty incentive plans, accounting for 35.7%, involve “shareholders holding individually or collectively more than 5% of the shares of a listed company, or actual controllers,” which is attributable to the fact that the founding or management teams of biopharmaceutical companies often have technical backgrounds. Thirty plans, representing 53.6%, involve foreign employees, as biopharmaceutical companies frequently recruit talent on a global scale.
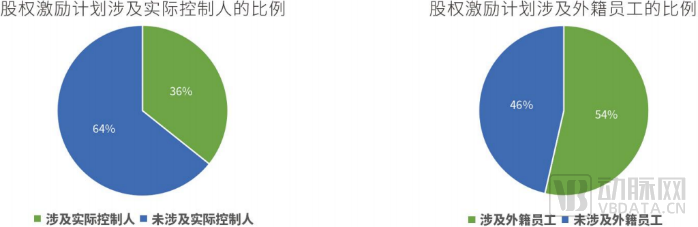
Note: The STAR Market has relaxed the restrictions on incentive recipients: “Shareholders holding individually or collectively 5% or more of the shares of a listed company, actual controllers, and their spouses, parents, and children, as well as foreign employees, may become incentive recipients if they serve as directors, senior management personnel, core technical personnel, or core business personnel of the listed company.”
IV. The grant price is approximately 50% of the company’s share price, and is below 50% when calculated against the average share price over the preceding 60 or 120 trading days.
Regarding the grant price, unlike the Main Board, the STAR Market allows for exemptions from the 50% discount limit under its rules. With an opinion issued by an independent financial advisor, grants may be made at a lower discount. The grant price discount is calculated as the grant price divided by the current fair market price, with the current fair market price referenced against the average trading prices over the 1, 20, 60, or 120 trading days preceding the announcement of the incentive plan.
Among the 56 incentive plans launched in the biopharmaceutical industry, the grant price was determined based on a discount to either the initial public offering (IPO) price or the closing prices on the 1st, 20th, 60th, or 120th trading day prior to the announcement of the incentive plan. The specific data are as follows:
● The grant price accounted for 55.1% of the average trading price of the stock on the preceding trading day
● The grant price accounted for 53.6% of the average trading price of the stock over the preceding 20 trading days
● The grant price accounts for 46.7% of the average stock trading price over the preceding 60 trading days
● The grant price accounted for 44.4% of the average trading price of the stock over the preceding 120 trading days
Data shows that the grant price, as a percentage of the average stock trading price over the preceding 1, 20, 60, and 120 trading days, has been gradually declining. Notably, the ratios relative to the 60-day and 120-day averages have both fallen below 50%, reflecting a recent decline in the stock prices of biopharmaceutical companies. In consideration of the financial capacity of the incentive recipients, companies often adjust the grant price appropriately in line with their stock performance.
Overall, the grant price of the incentive plans announced by biopharmaceutical companies is approximately 50% of their stock price. This 50% discount, which represents the regulatory minimum, takes into account practical considerations such as the company’s capacity to bear share-based payment expenses and the participants’ ability to contribute capital. It helps achieve a deep alignment of interests between employees and the company, thereby facilitating the smooth implementation of the incentive plans and maximizing their effectiveness.
V. Average vesting period of 4.3 years, with some companies establishing longer vesting schedules
Regarding vesting periods, the 56 incentive plans launched by biopharmaceutical companies had an average vesting period of 4.3 years. The most common vesting period was 4 years, accounting for 53.6%, followed by 4–5 years, which accounted for 25%.

In practice, companies establish differentiated vesting schedules and ratios based on their specific needs (such as R&D cycles for products and the number of newly approved self-developed products). Among them, some companies have set longer vesting periods. “Pumen Technology” has the longest vesting period, with an 8-year schedule in its first equity incentive plan. “MicroPort Endovascular Tech” also has a vesting period of up to 7 years, with vesting commencing only in the sixth year, and it includes the number of self-developed products as a metric in its performance assessments.
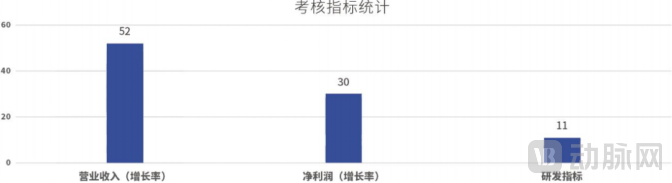
VI. Relatively Flexible Assessment Methods: 11 Equity Incentive Plans Include R&D Metrics
In terms of assessment methods, all biopharmaceutical companies that have launched incentive plans conduct evaluations at both the “corporate” and “individual” levels, and adopt a tiered vesting assessment model to achieve dynamic adjustment of the equity vesting ratio.
In terms of performance metrics, 52 incentive plans included operating revenue or operating revenue growth rate as assessment criteria, accounting for 92.9%, while 30 incentive plans incorporated net profit or net profit growth rate, representing 53.6%. These two metrics can authentically reflect a company’s operational and market conditions, serving as effective indicators for forecasting the expansion trends of its business operations and measuring its growth potential.
Meanwhile, as a typical technology-intensive industry, the biopharmaceutical sector places core emphasis on technological and product R&D progress. Eleven incentive plans incorporate R&D-related metrics, including the number of products developed, product sales volume, progress of R&D projects, and achievement of phased milestones for R&D projects.
It is worth noting that R&D capability is a key indicator for assessing the future growth potential of hard-tech companies. According to the 2021 annual reports released by biopharmaceutical companies listed on the STAR Market, some companies (such as Bloomage Biotech and Aier Eye Hospital) have included a portion of share-based payment expenses in their R&D expenditures. This practice, which strengthens equity incentives for R&D personnel, constitutes another form of increasing R&D investment.
Add the WeChat of the assistant below to get it for free.
Complete PDF Report File
Yi Can @ Xiao Can Mou: yican_001