Semper Maior: Time to Reboot Biotech

RA Capital
Life Sciences Venture Capital Firms
On January 3, ahead of the annual J.P. Morgan Healthcare Conference, RA Capital published a comprehensive 41-page report. Drawing on extensive data analysis, the report provided a high-level yet highly constructive assessment of the current state of the biotechnology industry and offered recommendations on how to address some of the issues that have emerged in this cycle as the next growth phase begins. The publication was widely read and sparked discussion within the U.S. industry.
The article is divided into three parts. In the first part, Peter Kolchinsky, Founding Partner of RA Capital, demonstrates through detailed data analysis thatAny analysis that focuses on the number of distressed biotech companies while ignoring their weight in the industry exaggerates current risks.By monitoring core biotech companies, specialized investment firms in this sector, and the M&A activities of strategic divisions within large pharmaceutical companies, we can see that the darkest hour has passed. The biotechnology industry is built on a solid foundation, and it is time for a recovery.
In the second part of the article, Peter Kolchinsky discusses, from a practical operational perspective, what issues were exposed in the biotechnology industry’s systemic operations during this cycle, and how to prepare a more robust operational system for the next cycle—for instance, how to conduct an initial public offering (IPO) in the upcoming cycle.
Peter Kolchinsky wrote, “We learned in the last cycle that IPOs proceed more smoothly when participants have confidence in the price discovery process. Furthermore, the recent recession has begun to instill a deeper understanding of efficiency within our industry. Even as capital becomes more accessible, we cannot afford to become complacent. Our industry has spent excessively on financing costs, directors and officers (D&O) insurance, and clinical trials that failed to meet expectations. We have devoted too much time to board meetings that proved less efficient than anticipated. Let us reboot the operating system of the biotechnology industry, learning how to raise capital with integrity and deploy it wisely.”
In Part III, Peter Kolchinsky discussed the impact of the Inflation Reduction Act (IRA). Since its enactment, the IRA’s drug price negotiation provisions—often dubbed “America’s version of medical insurance negotiations”—have sparked significant repercussions and controversy within the pharmaceutical industry. The U.S. pharmaceutical sector has voiced strong grievances, with ongoing debates over whether price negotiations will constrain innovation in new drug development. This mirrors the earlier controversies experienced by China’s domestic pharmaceutical industry regarding medical insurance negotiations and centralized volume-based procurement.
Peter Kolchinsky wrote, “The social contract of the biotechnology industry, and the public’s perception of our industry’s value proposition, permeate everything we do, so pervasively that they are like water to a fish—unseen. We have taken this contract for granted, yet its erosion has begun to seriously threaten our capacity for innovation. If the impact was not clear before, the Inflation Reduction Act (IRA) has sounded a wake-up call for everyone in the drug development industry: for us, merely treating and curing diseases is no longer enough.”
He believes that unless we can help insurers cover innovative drug products at appropriate prices and earn the trust of the public and policymakers, convincing them that our products are truly worth their price, our industry will continue to be viewed with disdain.
The second section of the article is replete with specific operational details on how to conduct an initial public offering (IPO), while the third section provides a brief overview of the U.S. policy environment; these sections are not translated here. However, VCBeat New Medicine has provided a full translation of the first section, including seven figures and two tables.
We believe this content is highly valuable, as it offers a perspective for observing and understanding the industry.We also hope that this perspective will offer insights to industry professionals in China, particularly investment institutions.
The following:
Preface
(January 3, 2023) Each week, we hear alarming facts about the number of companies trading below cash value—a situation where a company’s market capitalization falls below its cash on hand—and how much capital they will need to raise in the coming year. This seems to suggest that biotechnology has been abandoned by many investors, and the few remaining investors will be unable to save the already precarious biotech industry from further liquidation.
I believe these data obscure a fact that at least some experts have already recognized:The foundation of the biotechnology industry is significantly more robust.
Here, I will attempt to persuade you. Once I have done so, I hope you will join me in looking toward the future and consider rebooting the biotech operational system in the next cycle, as there were some issues in the previous one.
“Cycles” implies that we are destined to repeat the feast-or-famine pattern that has dominated the biotechnology industry for decades. Yet, whether for better or worse, we reap what we sow. These cycles appear inevitable because, on a practical level, we cannot curb the broad enthusiasm from investors—where people are free to hype up stocks, and the resulting optimistic “can-do” attitude becomes contagious—thereby sowing the seeds of downturn as the boom fades.
Once we accept that, like all innovations, investor interest and confidence in biotechnology’s ability to change the world and create value are inherently volatile, let us consider how to navigate this fluctuation.Specifically, let us consider how to sustain the development of all outstanding and valuable products in the biotechnology industry, so that they will not be left stranded when the tide recedes indiscriminately.
By “we,” I mean you and me. Through one “cycle” after another, “we” have worked and lived in this field, persevering steadfastly, and we know what biotechnology can achieve.Our work, whether as investors, board members, or operators (the boundaries between these roles have become blurred), requires us to persevere through short-term volatility.We carry forward the lessons and insights from the past into our next project, next company, next funding round, and next cycle, determined to do better. We measure our success by the value of drugs and other products launched during our careers, as well as by sustainable economic returns—objectives that often coexist over the long term.
“We” remain the decision-makers. We collectively determine which preclinical projects receive funding, disseminate policy information such as that from the Inflation Reduction Act, and decide which drugs will see the light of commercialization after a decade of research and development.
We are currently experiencing a downturn characterized by a sustained decline in interest in biotechnology. Rising interest rates have weakened the overall performance of the stock market, exacerbating this slump. We must now determine: 1) how severe this recession may become; and 2) what different choices we will make once we embark on the recovery.
"The Darkest Hour Has Passed; We Stand on a Solid Foundation"
I believe biotech companies have already witnessed the worst of this downturn, and I think this situation has persisted for some time. We have been rebounding from the trough for about six months, with each rally slightly easing the sluggish sentiment in the biotechnology sector.
However, this is not to say that some biotech companies will not go bankrupt or lose value due to their own specific reasons (as most clinical trials end in failure). What I mean is that the industry is not struggling under immense challenges as overly broad statistical data might suggest, if you only look at the number of companies struggling in difficult situations.
To conduct a proper analysis, we must first clarify the perspective from which we are observing.
An outsider considering whether to invest in biotechnology would typically see investment minefields, which have now become even more unsuitable for action due to the polar vortex of financing.After all, there are 660 drug development companies listed in the United States, among which 214 have a market capitalization lower than their cash on hand. At least 358 of these biotech companies have less than two years of cash runway, with a burn rate-to-market cap ratio far exceeding 25%.This could pose challenges to fundraising (hence we refer to it as the “danger zone”). These figures have fluctuated over the past six months, but they remained at similarly poor levels for most of 2022.
Although there are indeed hundreds of companies (see Figure 1) that need to raise substantial capital in the coming year (those with less than two years of cash runway need to raise $33 billion to extend their operational timeline by one more year; see Table 1),But the real issue lies in how to interpret these statistics.. It is easy to assume that, since generalist venture capital firms have abandoned this sector, the burden of funding all these companies will fall disproportionately on specialist investment institutions within the industry, signaling trouble ahead.
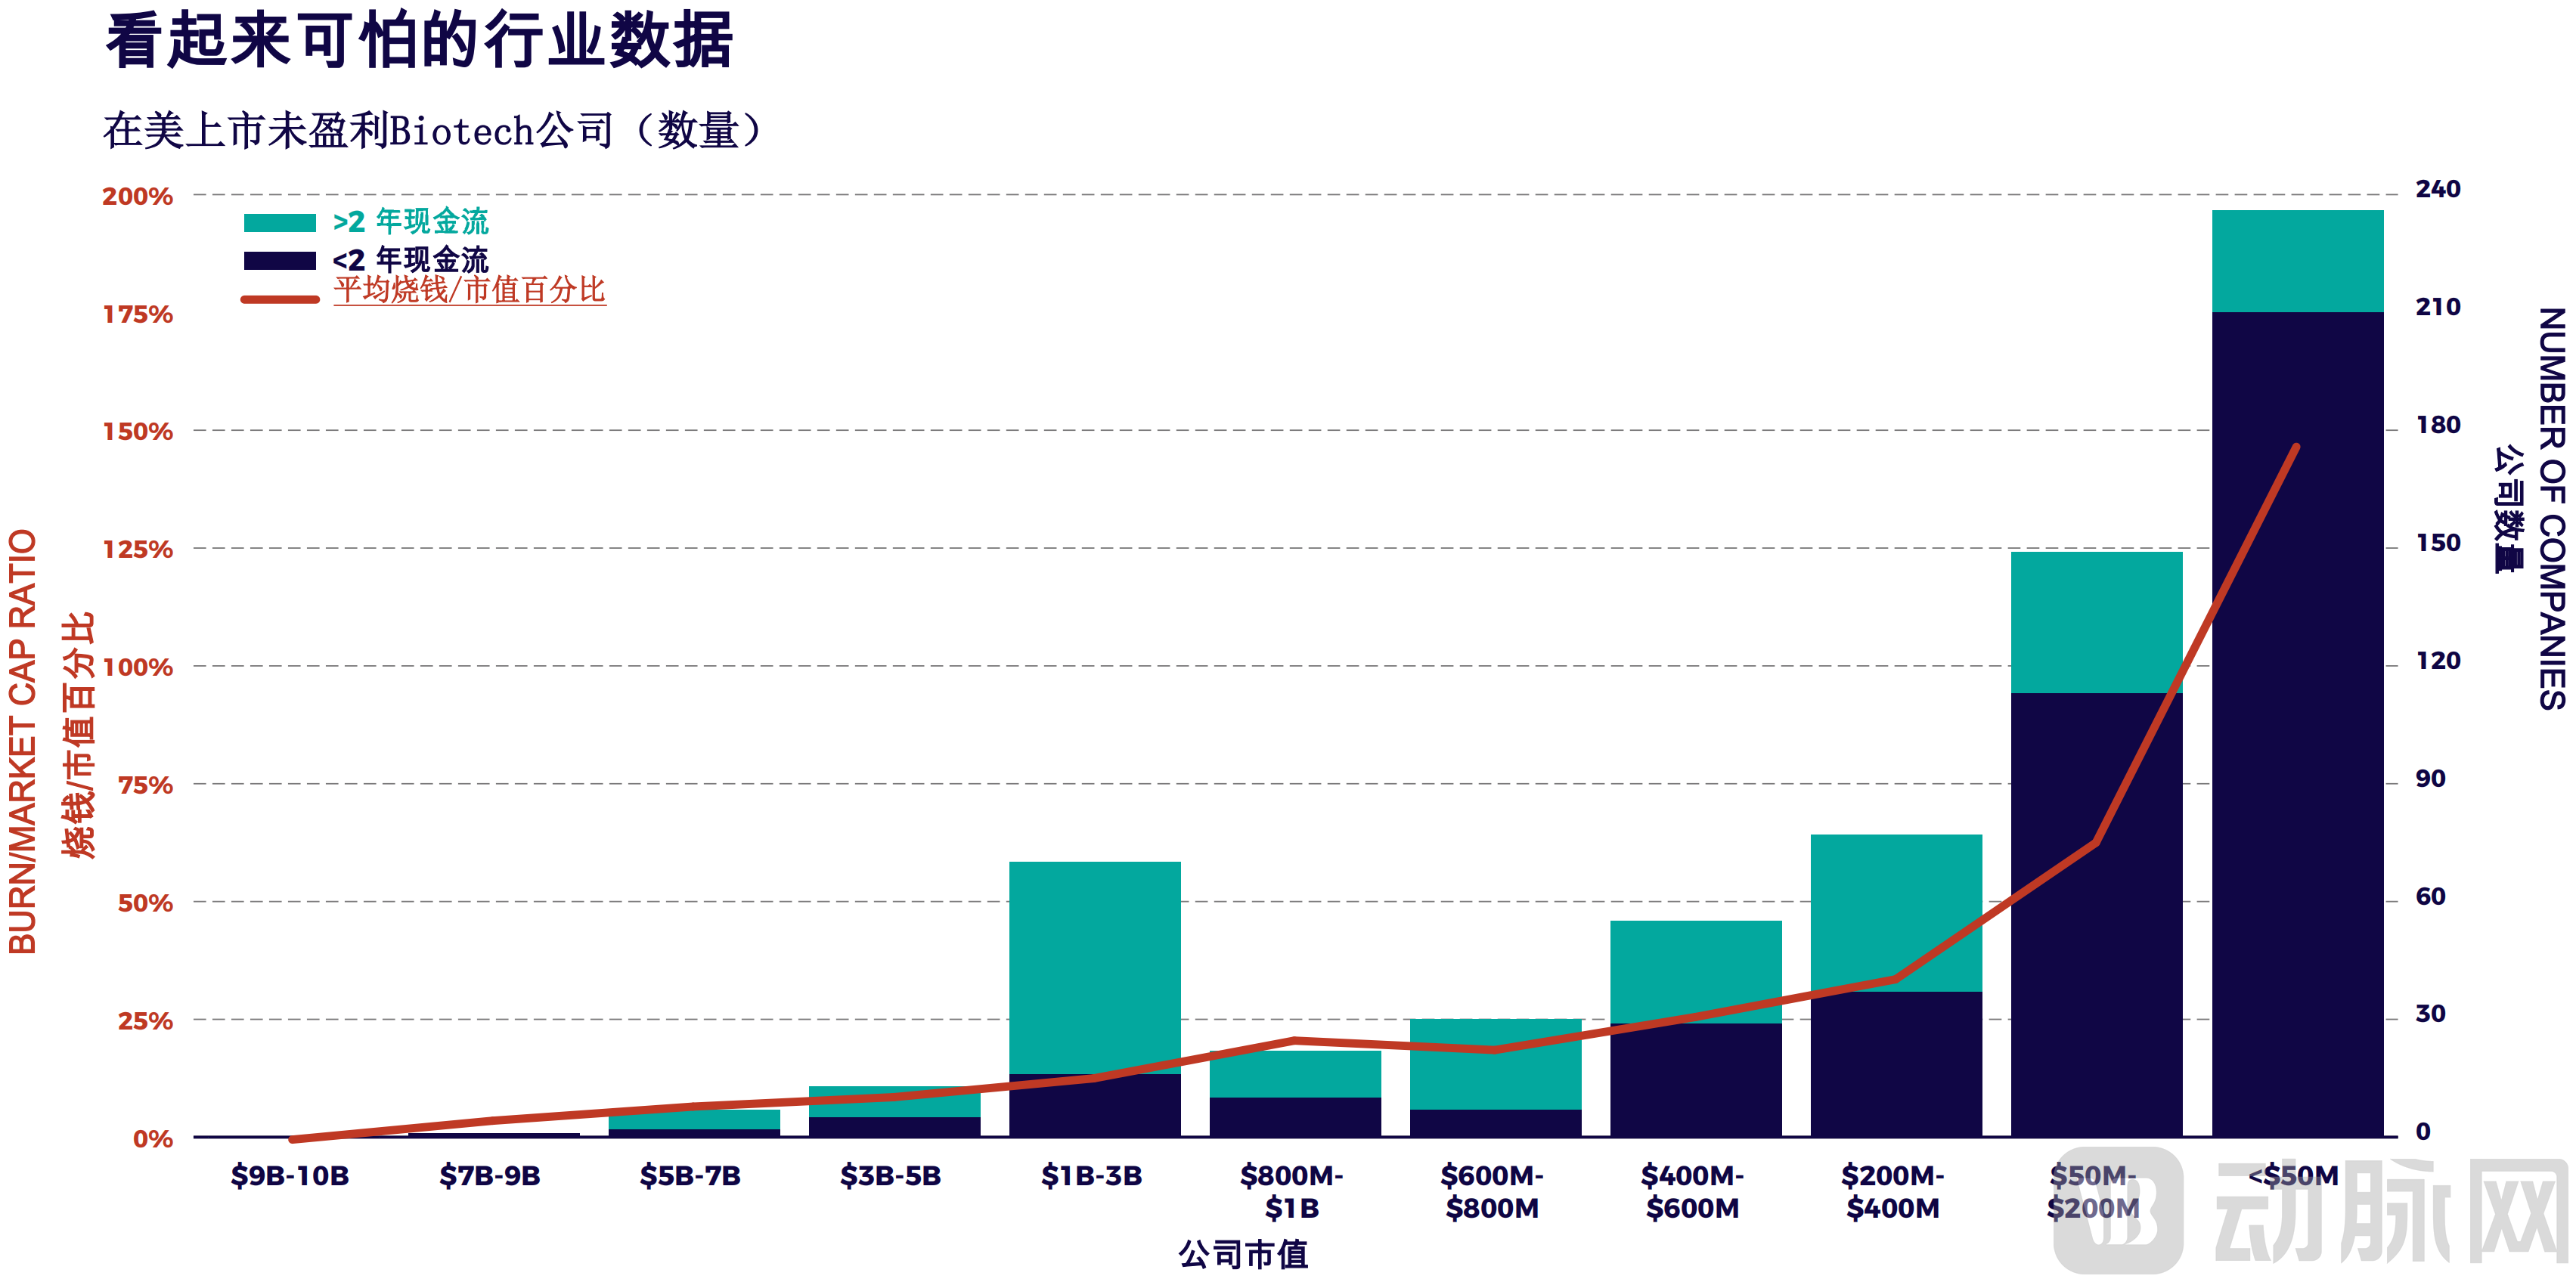 Figure 1: General Industry Data That Looks Alarming
This chart displays the number of biotech companies across different market capitalization ranges (right axis) as of 2022. The dark blue bars represent the number of biotech companies with less than two years of cash runway, while the green bars indicate those with more than two years of cash runway. The left axis shows the burn rate-to-market cap percentage for biotech companies in each market cap range. Notably, hundreds of companies with a market capitalization below $200 million are running out of cash; they need to raise funds equivalent to nearly half of their market cap to sustain operations for one year. Indeed... this looks alarming.
However, if we want to know whether professional investment institutions are heavily burdened by the financing needs of companies within their portfolios, we should examine their portfolios rather than relying on overly broad statistical data.
1Core Biotech Companies
So, how should we determine the financing burden faced by professional investment institutions? First, our team defined a core group of biotech-focused professional investment institutions, totaling several dozen, with the aim of listing all Biotech companies held by at least one professional investment institution (based on their recent 13F filings) asCore Biotech Companies. Companies that are not held by a professional investment institution, we refer to asPeripheral Companies。
We must also determine which companies constitute our biotech universe. We aim to focus on drug development companies (rather than diagnostics and medical devices), as these firms typically generate no revenue, and their R&D processes are lengthy, high-risk, and costly—aligning with the common perception of the biotechnology R&D landscape.
We focus further on pharmaceutical companies that are still burning cash, as profitable firms typically raise no concerns and may even dilute the risk metrics we seek to quantify. Moreover, most specialized biotech investment institutions are investing in cash-burning biotech companies, and they may even consider the strategy for investing in profitable companies to be entirely different.
We then focused on companies listed in the United States (including foreign companies listed in the U.S.), as we have clear shareholding data that allows us to cross-reference these companies with our list of professional institutional investors. We excluded 30 unprofitable foreign pharmaceutical companies because we could not determine their shareholders. It would be unfair to label them as peripheral companies, since they might technically be held by professional institutional investors through their overseas listings. However, they accounted for only 1% of the total market capitalization in our dataset, thus having negligible impact on our analysis. If a company was dual-listed in the United States and elsewhere, and its U.S. listing revealed one or more professional shareholders, we included it in the core company cohort.
To avoid the risk of underestimating the level of danger in the biotechnology sector, we excluded five unprofitable core biotech companies with valuations exceeding $10 billion: Alnylam, Seagen, Beigene, Argenx, and Sarepta. We believe it is universally acknowledged that these companies do not face the risk of running out of cash, as their revenues are growing steadily; even at current burn rates, they maintain two years of cash reserves, and their cash-burn-to-market-cap ratios are relatively low. When calculating the cumulative denominator, excluding these five companies—with a combined market capitalization exceeding $100 billion—from the weighting of core biotechnology portfolios held by professional institutional investors constitutes a conservative approach, thereby enriching our analysis of any financing risks within the biotechnology ecosystem.
Finally, privately held biotech companies are excluded. Undoubtedly, these companies are in a worse position for two reasons: first, the amount of private capital available is smaller than that of public capital. Second, many specialized funds are typically established for cross-investment (both public and private), forcing private capital to compete more intensely with public capital than in the past. Without knowing their cash burn rates, it is impossible to assess the capital status of private companies; therefore, we exclude them here, as others have already excluded them from general statistics.
Therefore,We ultimately included 660 unprofitable pharmaceutical companies listed in the United States, each with a market capitalization of less than $10 billion. We then cross-referenced these companies with a range of specialized investment institutions to categorize them into core and peripheral companies.
Then, we repeated the same analysis as in Figure 1 (see Figure 2), revealingMany risk indicators in the biotechnology industry are actually concentrated in peripheral companies and do not affect professional investment institutions or their limited partners.
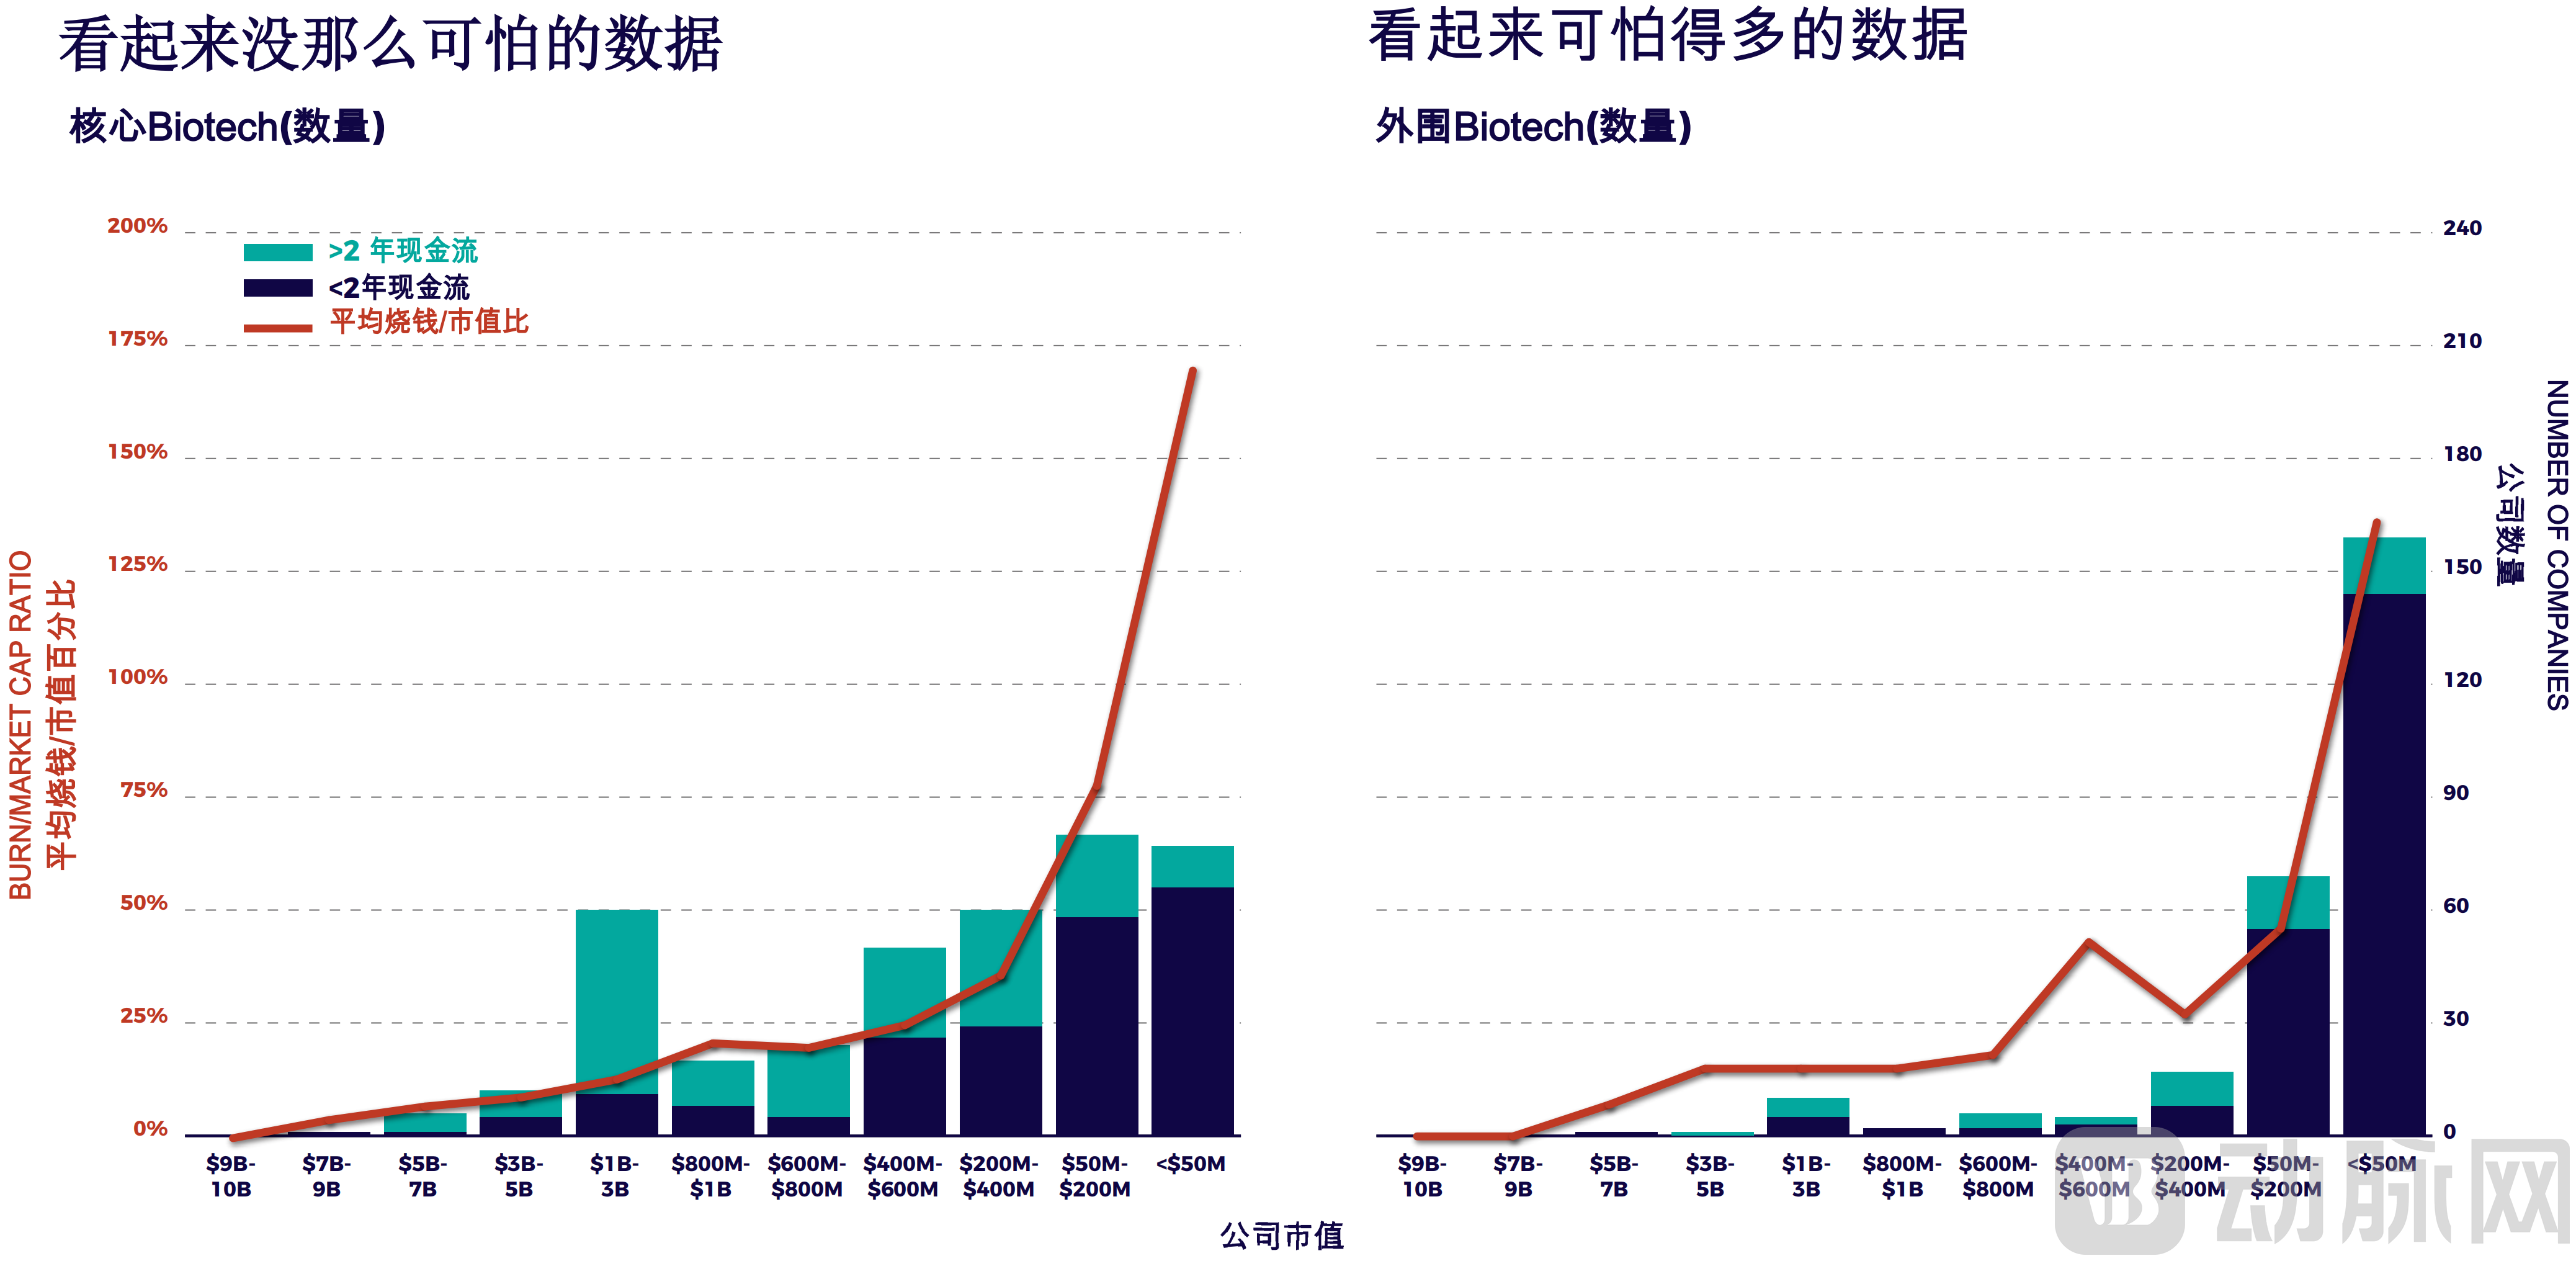
Figure 2: The narratives of the two types of biotech companies are entirely different
Number of Core Biotech Companies by Market Capitalization (Left Chart) vs. Number of Peripheral Biotechnology Companies (Right Chart). Hundreds of small biotech companies struggling with valuations below $200 million are nascent peripheral entities; they have no need to raise capital from specialized funds and do not impact the returns of such funds (therefore, peripheral companies do not constitute a source of risk for partners of specialized funds).
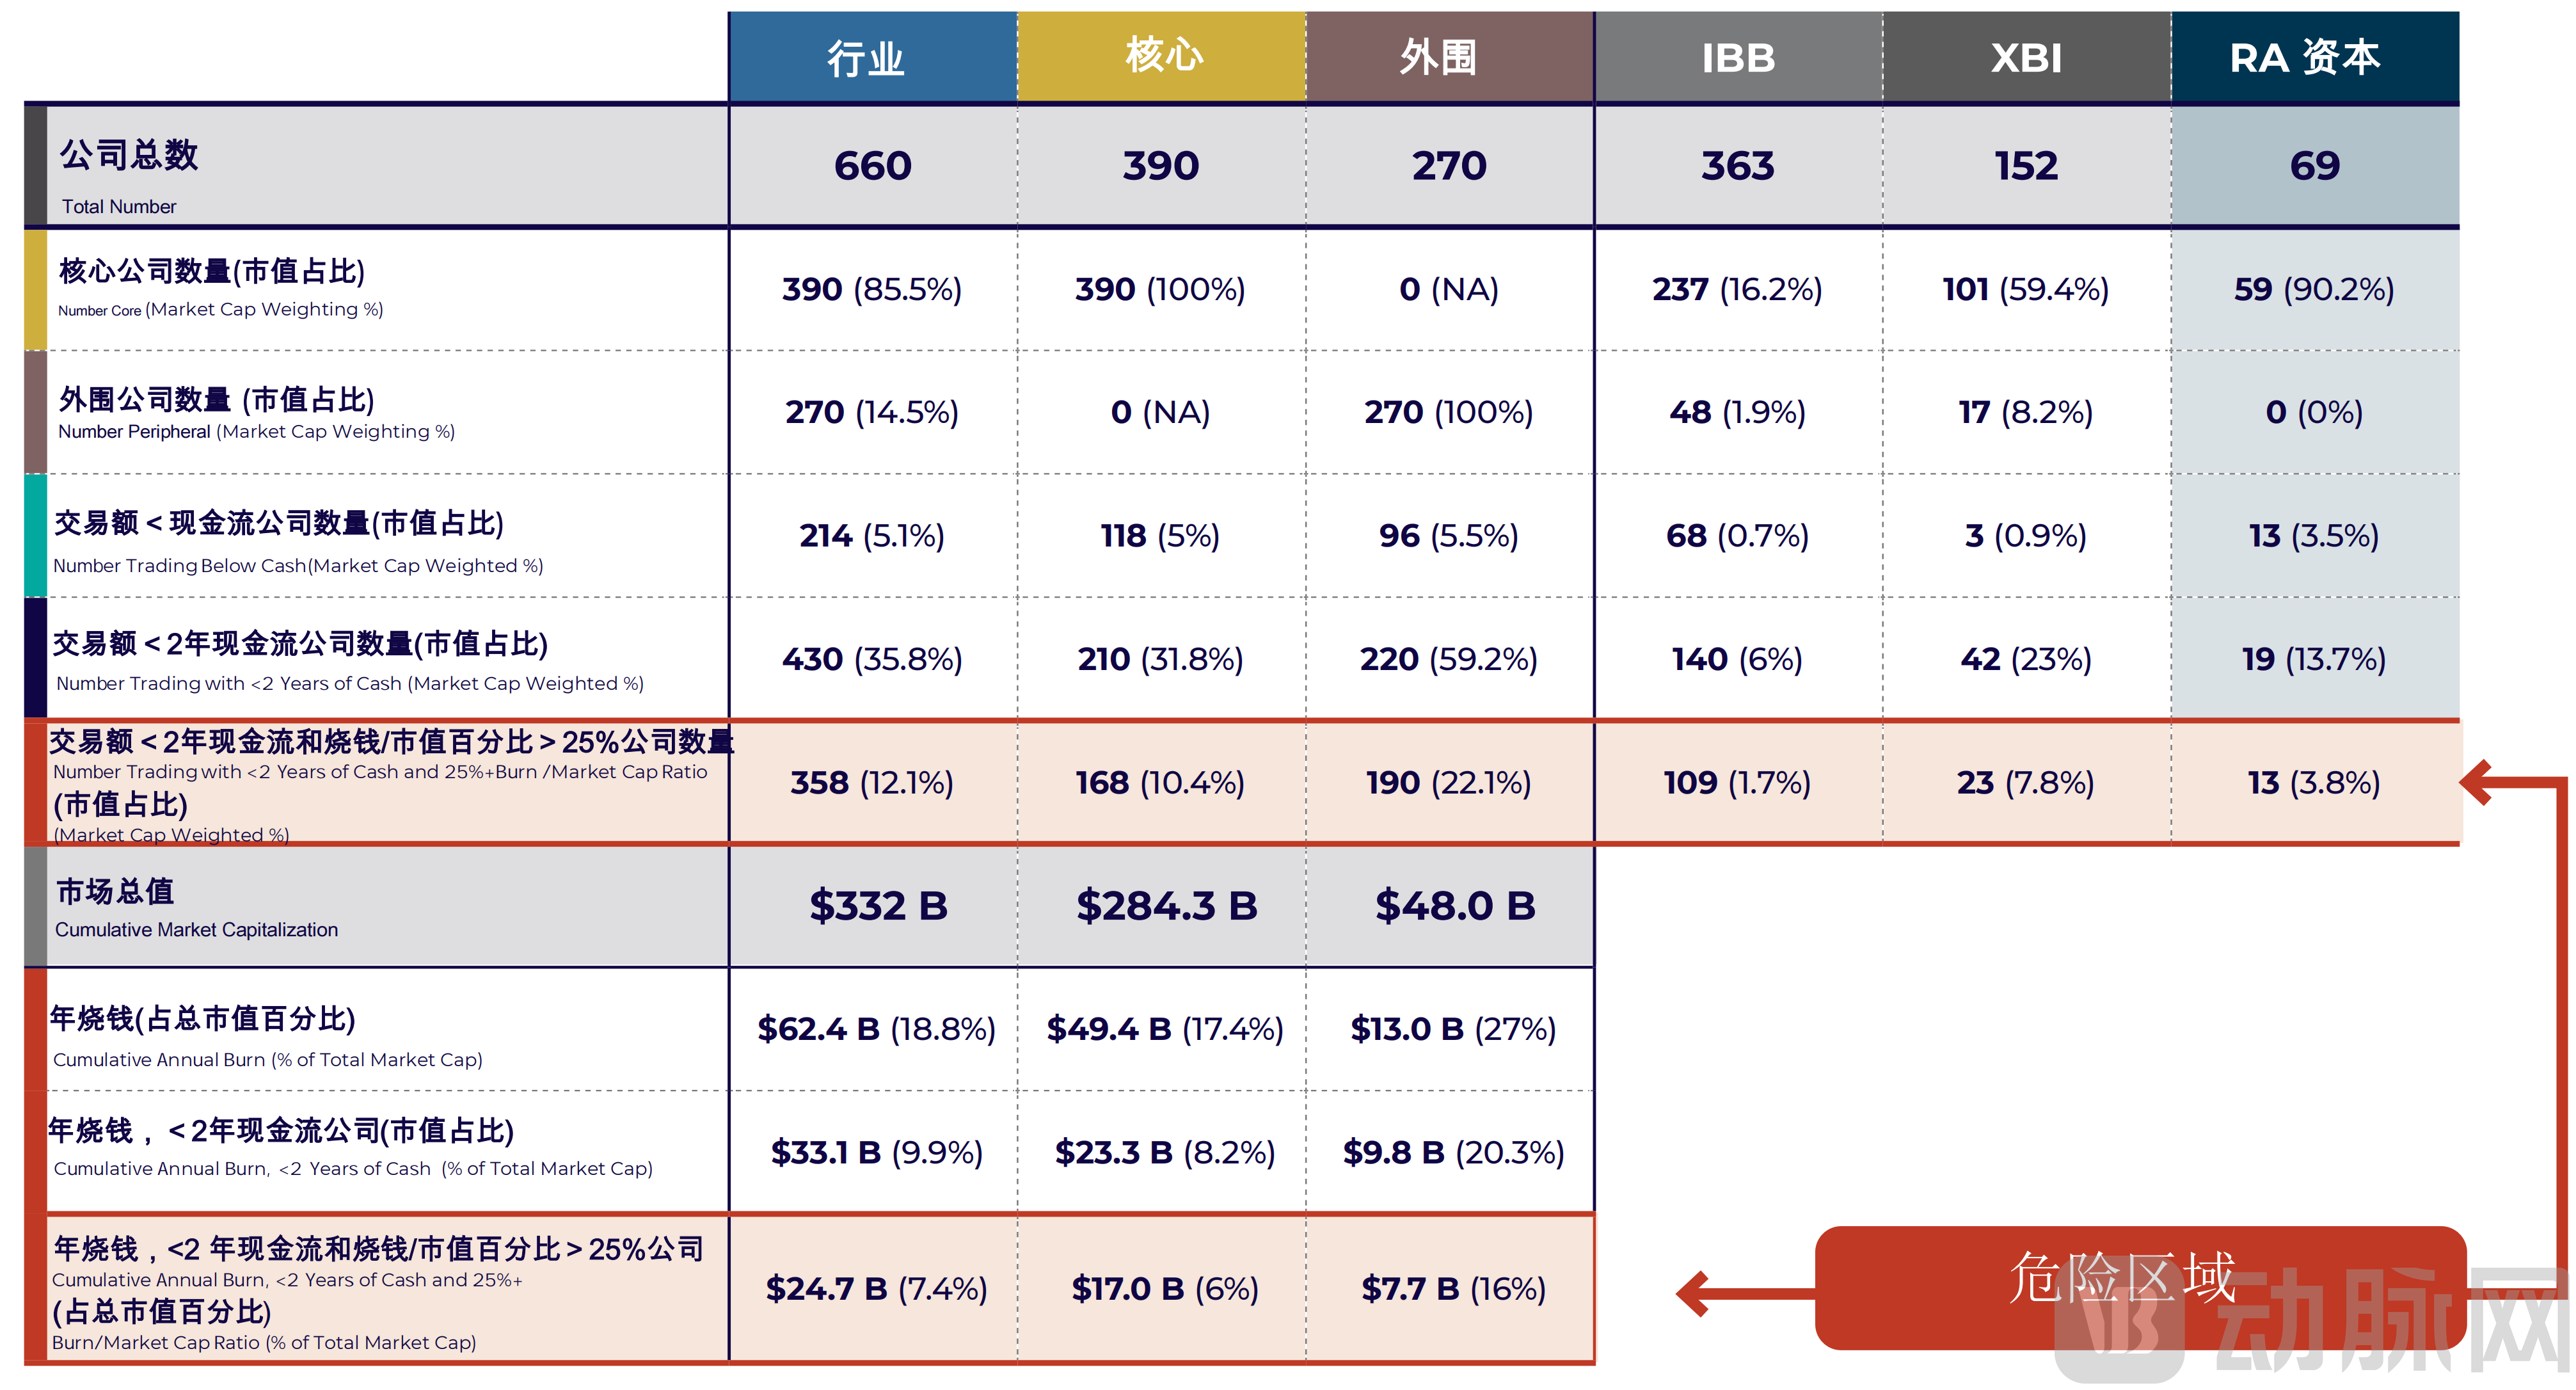
Table 1 includes early-stage biotech companies, core companies, and peripheral companies, two biotech sector ETF indicators (IBB, XBI), and RA Capital’s portfolio companies. Since this analysis excludes profitable companies, companies with a market capitalization exceeding $10 billion, and those engaged in diagnostics, medical devices, and generic drugs, the combined values of the two ETFs do not sum to 100%. For RA Capital, we used actual holdings data (as we have access to this information); had we used 13F data (which we rely on for analyzing other funds), no metric would exceed 1.6%, giving us confidence in the validity of using 13F data.
2The Positive Side: Peripheral Companies Are Affected, But Not in the Way You Think
The performance of peripheral companies has little impact on professional institutional investors, as they typically do not invest in these entities. In rare cases, when a peripheral company announces transformative positive news, professional institutional investors may choose to invest in it, thereby transforming it into a core portfolio company. If a peripheral company fails, its employees may join core companies, helping them achieve their strategic objectives. Thus, for professional institutional investors, peripheral companies effectively serve as a free option pool and resource reservoir.
Admittedly, the bankruptcy of peripheral companies may trigger some “contagion” in the capital markets, dragging down certain indices and potentially scaring away retail investors and multi-strategy institutional investors, thereby deterring them from taking further risks in the biotechnology sector, including investments in some core companies. However, given that the benchmarks have only limited exposure to peripheral companies (8% for XBI and 2% for IBB) and even lower exposure to those companies experiencing financial distress (see Table 1),Therefore, the contagion risk from peripheral companies to core companies is very low; it will only affect perceptions of the industry rather than the actual portfolios of professional investment institutions.
When people express concerns about troubles in the biotechnology industry, they are not alluding to this kind of “contagion.” What they actually worry about is that specialized biotech funds lack sufficient capital to meet the financing needs of all the companies that depend on them.
Of course, from the perspective of professional investment institutions and their limited partners, peripheral biotechnology companies should be excluded from industry risk assessments, as these companies are unable to secure investment from professional capital.
3Weighted... Weighted..
It is insufficient to merely categorize all companies facing financing difficulties into core and peripheral segments. In reality, professional institutional investors have even less exposure to distressed biotech companies. Given their small market capitalizations and minimal weight in institutional portfolios, the risk exposure of professional institutional investors to distressed biotech firms is further reduced.
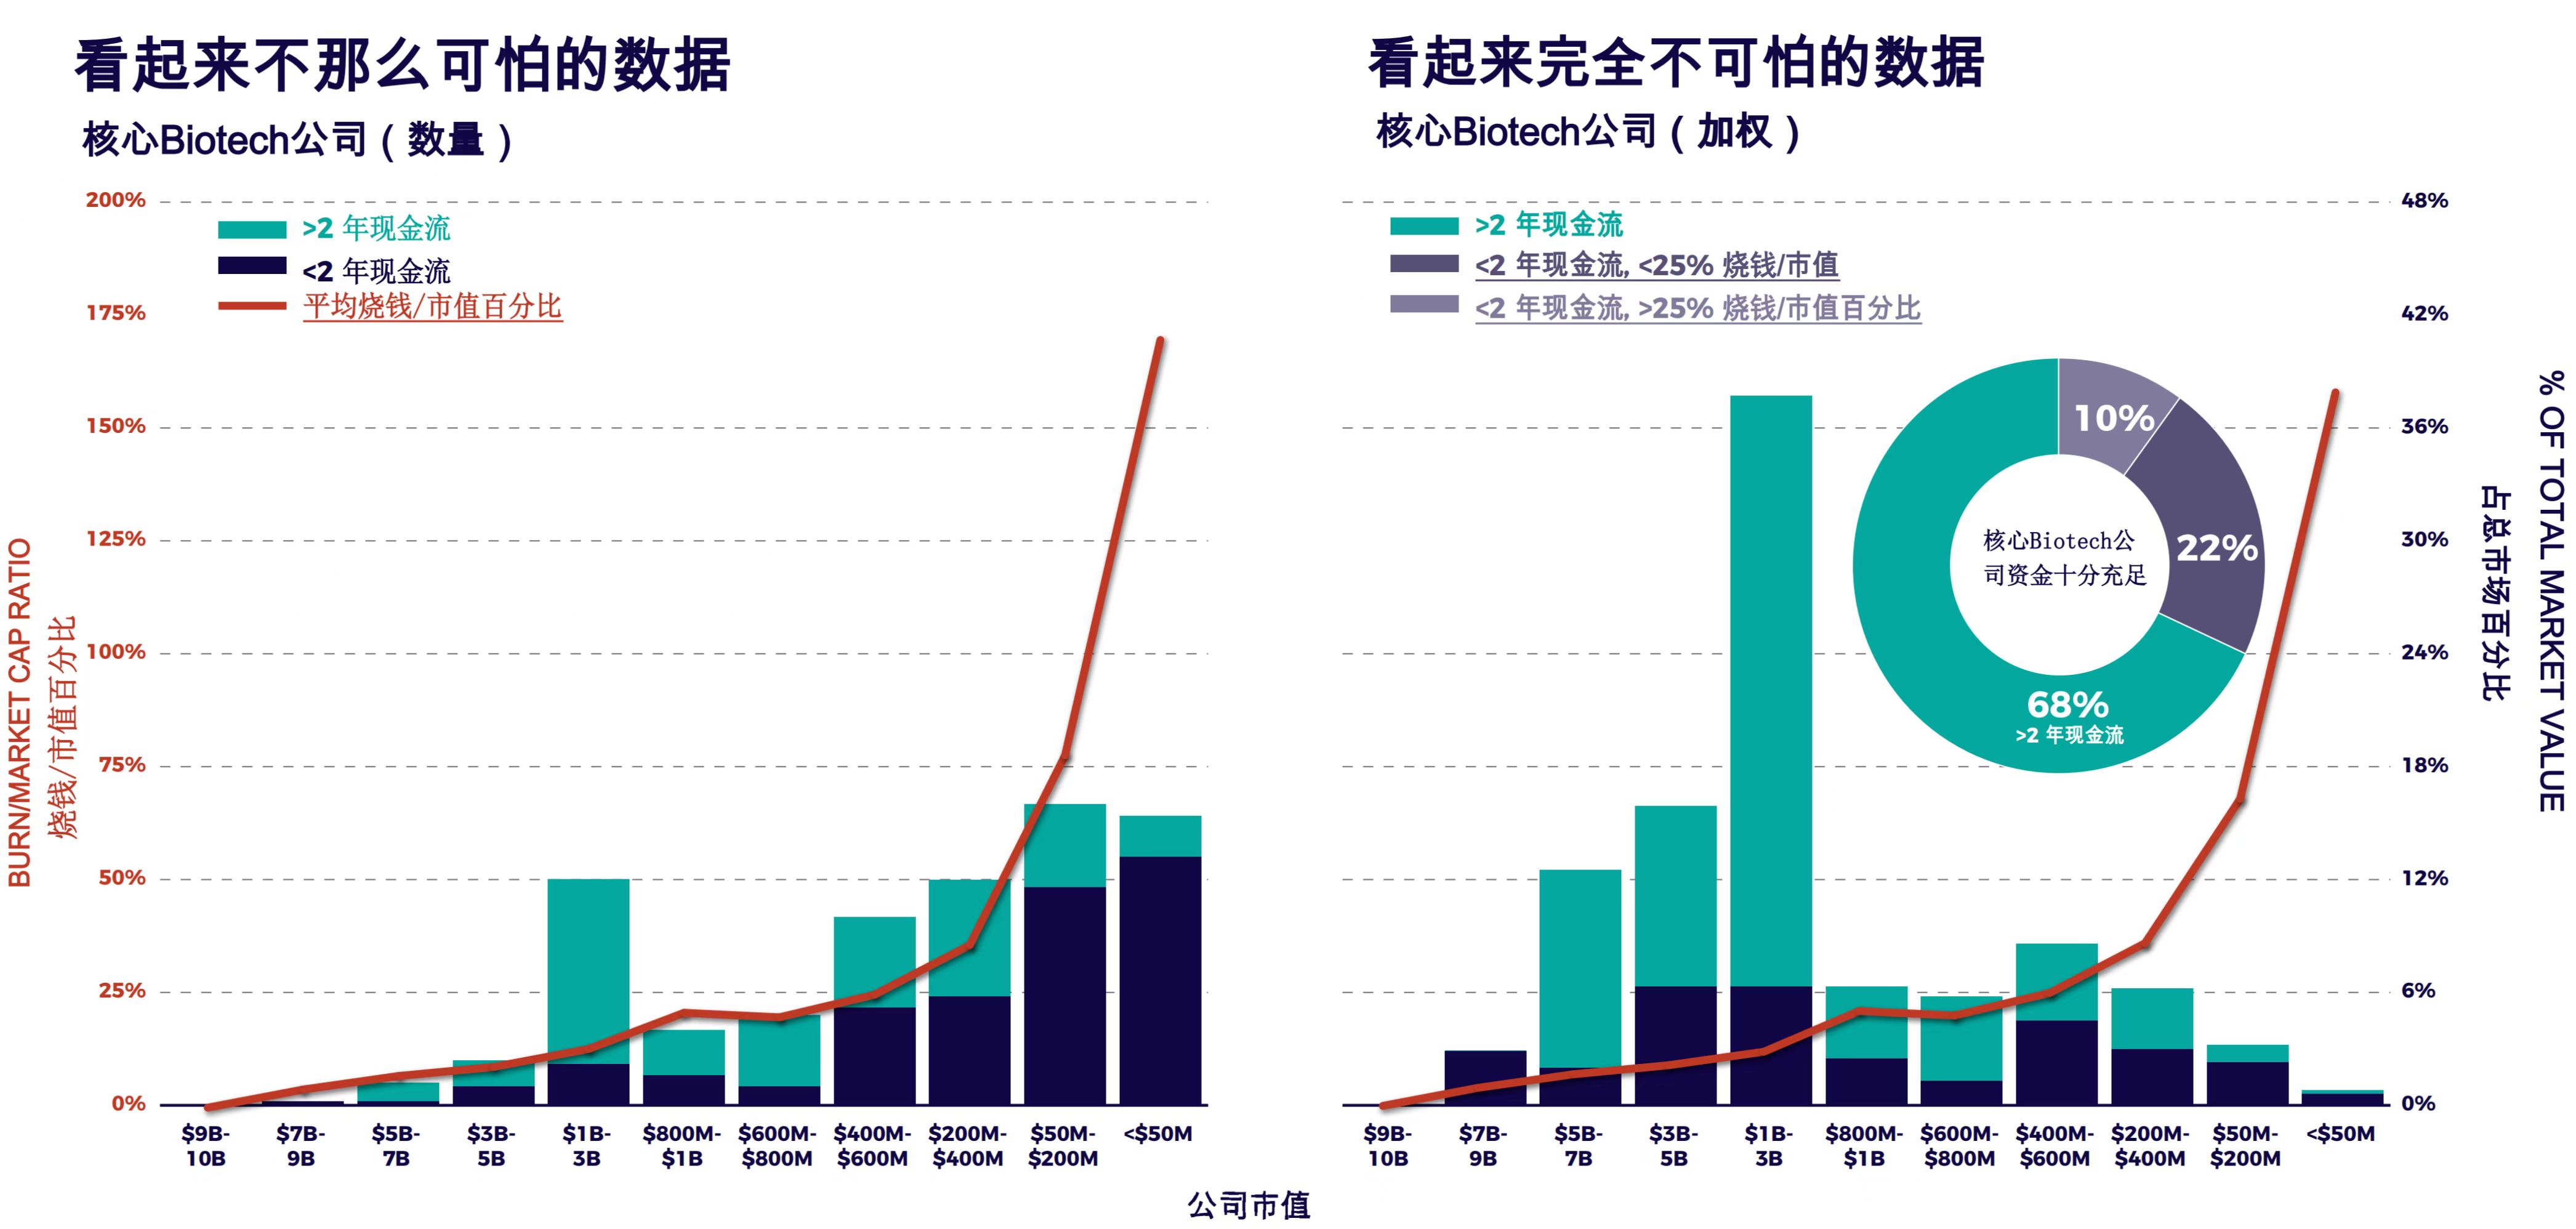
Figure 3. Increase the weight slightly
Figure 3 shows the proportion of core biotech companies within each market capitalization range, further stratified by whether their cash runway exceeds two years. As shown in the chart on the right, distressed small-cap companies constitute only a minor portion of professional investors’ portfolios; thus, their potential failure would have limited impact on overall investment returns. Consequently, the majority of professional investment in the biotech sector is allocated to companies with healthier financial positions. The pie chart indicates that, on a weighted basis, 68% of core biotech holdings have more than two years of cash runway, while among the remaining 32%, less than one-third are in a financing distress zone.
If all core biotech companies were consolidated into a single specialized investment portfolio, the vast majority of holdings would comprise well-capitalized companies and those with reasonable cash burn rates relative to their market capitalizations. As shown in Figure 3, these companies should be able to secure financing without significant difficulty.
To be fair, any analysis based on the number of biotech companies rather than their market capitalization weights exaggerates the risk. You don’t even need to segment them into core and peripheral categories. Figure 4 below simply applies market-cap weighting to all 660 biotechnology companies, showing that distressed micro-cap companies account for only a small fraction of the entire biotechnology sector.
If all companies with a market capitalization below $200 million were to go bankrupt, this would represent only a 6% reduction in the broader investment portfolio, yet it would eliminate the vast majority of financially distressed firms. It is precisely these companies that make the biotechnology industry appear highly risky today (i.e., excluding 200 out of 214 companies trading below their cash value, and removing 304 out of 359 companies in the danger zone [with less than two years of cash runway and a burn-rate-to-market-cap ratio exceeding 25%]).
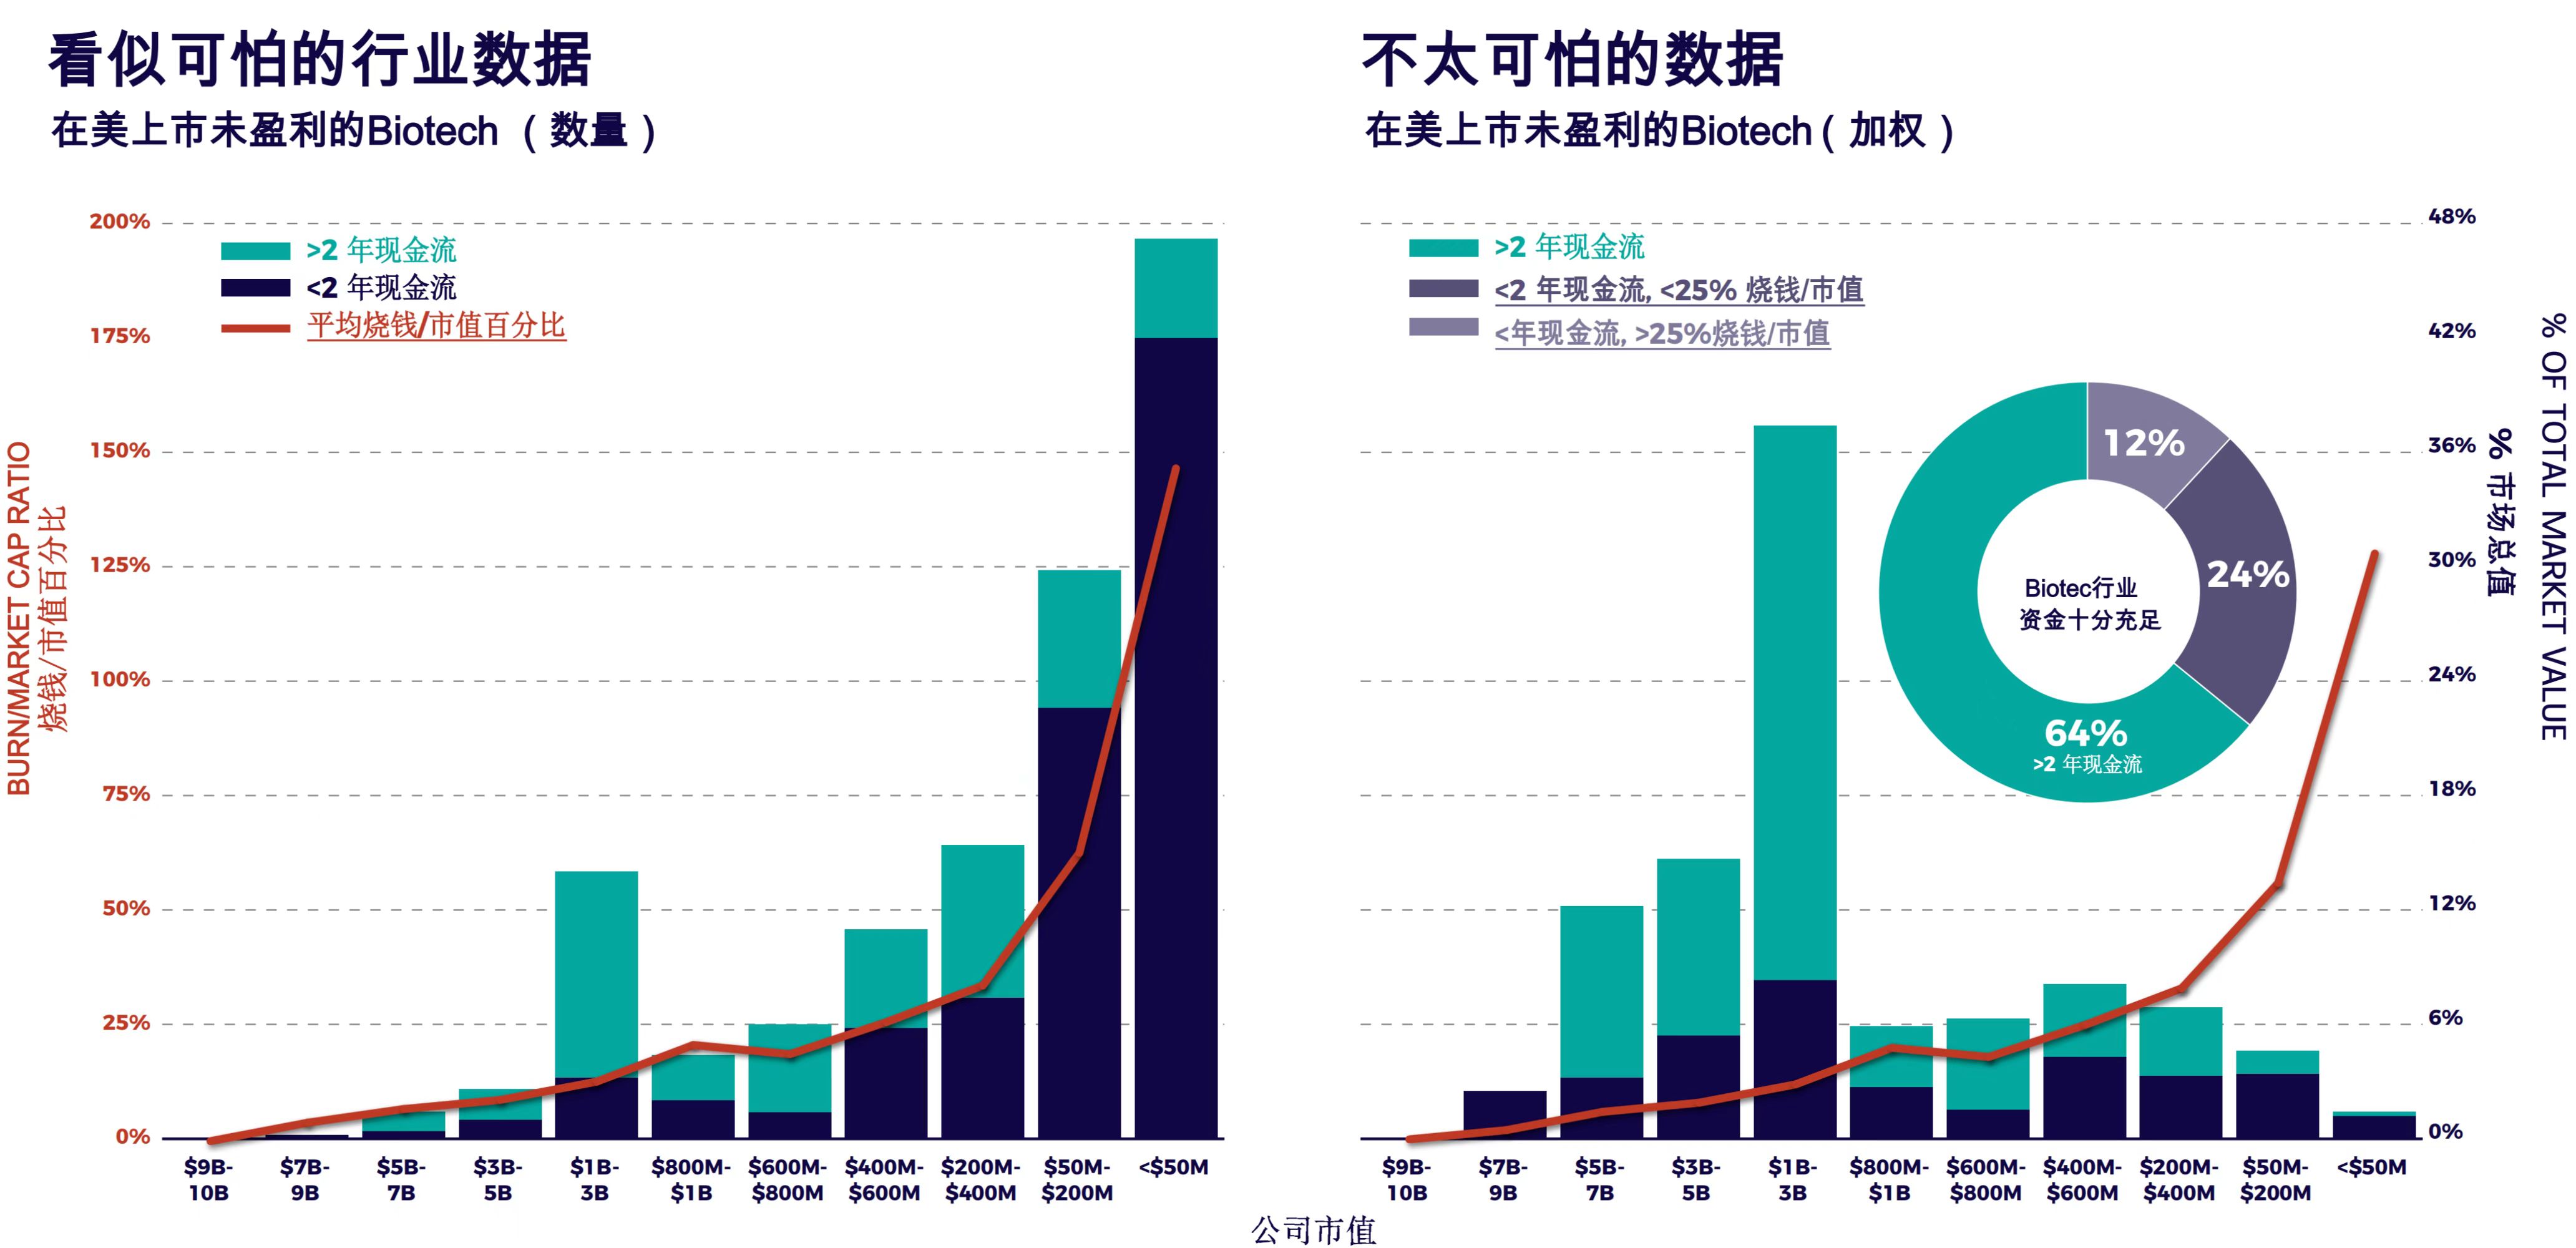
Figure 4: Biotech Sector Data Looks Less Alarming After Market-Cap Weighting
The chart on the left is identical to Figure 1, showing the 660 companies in the biotech sector categorized by cash flow and market capitalization, along with the burn rate-to-market cap ratio for each market cap segment. The chart on the right presents a market-cap-weighted view of the biotech industry. We observe that professional institutional investors rarely choose high-risk companies (as illustrated in the pie chart: 64% of companies have more than two years of cash runway; among the remaining companies, only one-third exhibit a high burn rate-to-market cap ratio, which indicates difficulty in securing financing).
4Zooming in to the individual fund level
Compared with general statistical data (see Table 1), 54% of the 660 companies fall into the high-risk financing zone (<2 years of cash runway, burn rate/market cap ratio >25%). Our fund-level data shows that most funds have an exposure of less than 10% to such companies (note that this data may be flawed due to the limitations of 13F filings).
Let us also consider the most popular metric for gauging the health of the biotechnology industry in 2022: companies trading below their cash value. Indeed,Of the 390 core companies, 30% are trading below their cash value. However, the majority of these companies have a market capitalization of less than $200 million and carry low weightings in the portfolios of professional institutional investors.If all companies with a market capitalization below $200 million were to go bankrupt, professional institutional investors would incur losses of approximately 4% compared to the closing levels in 2022. However, among the remaining 233 companies in their portfolios, only 13 are trading below their cash value. Suddenly, this sounds less alarming.
However, let us assume that professional investment institutions did not abandon any company in need of cash and contributed their respective shares to each financing round.
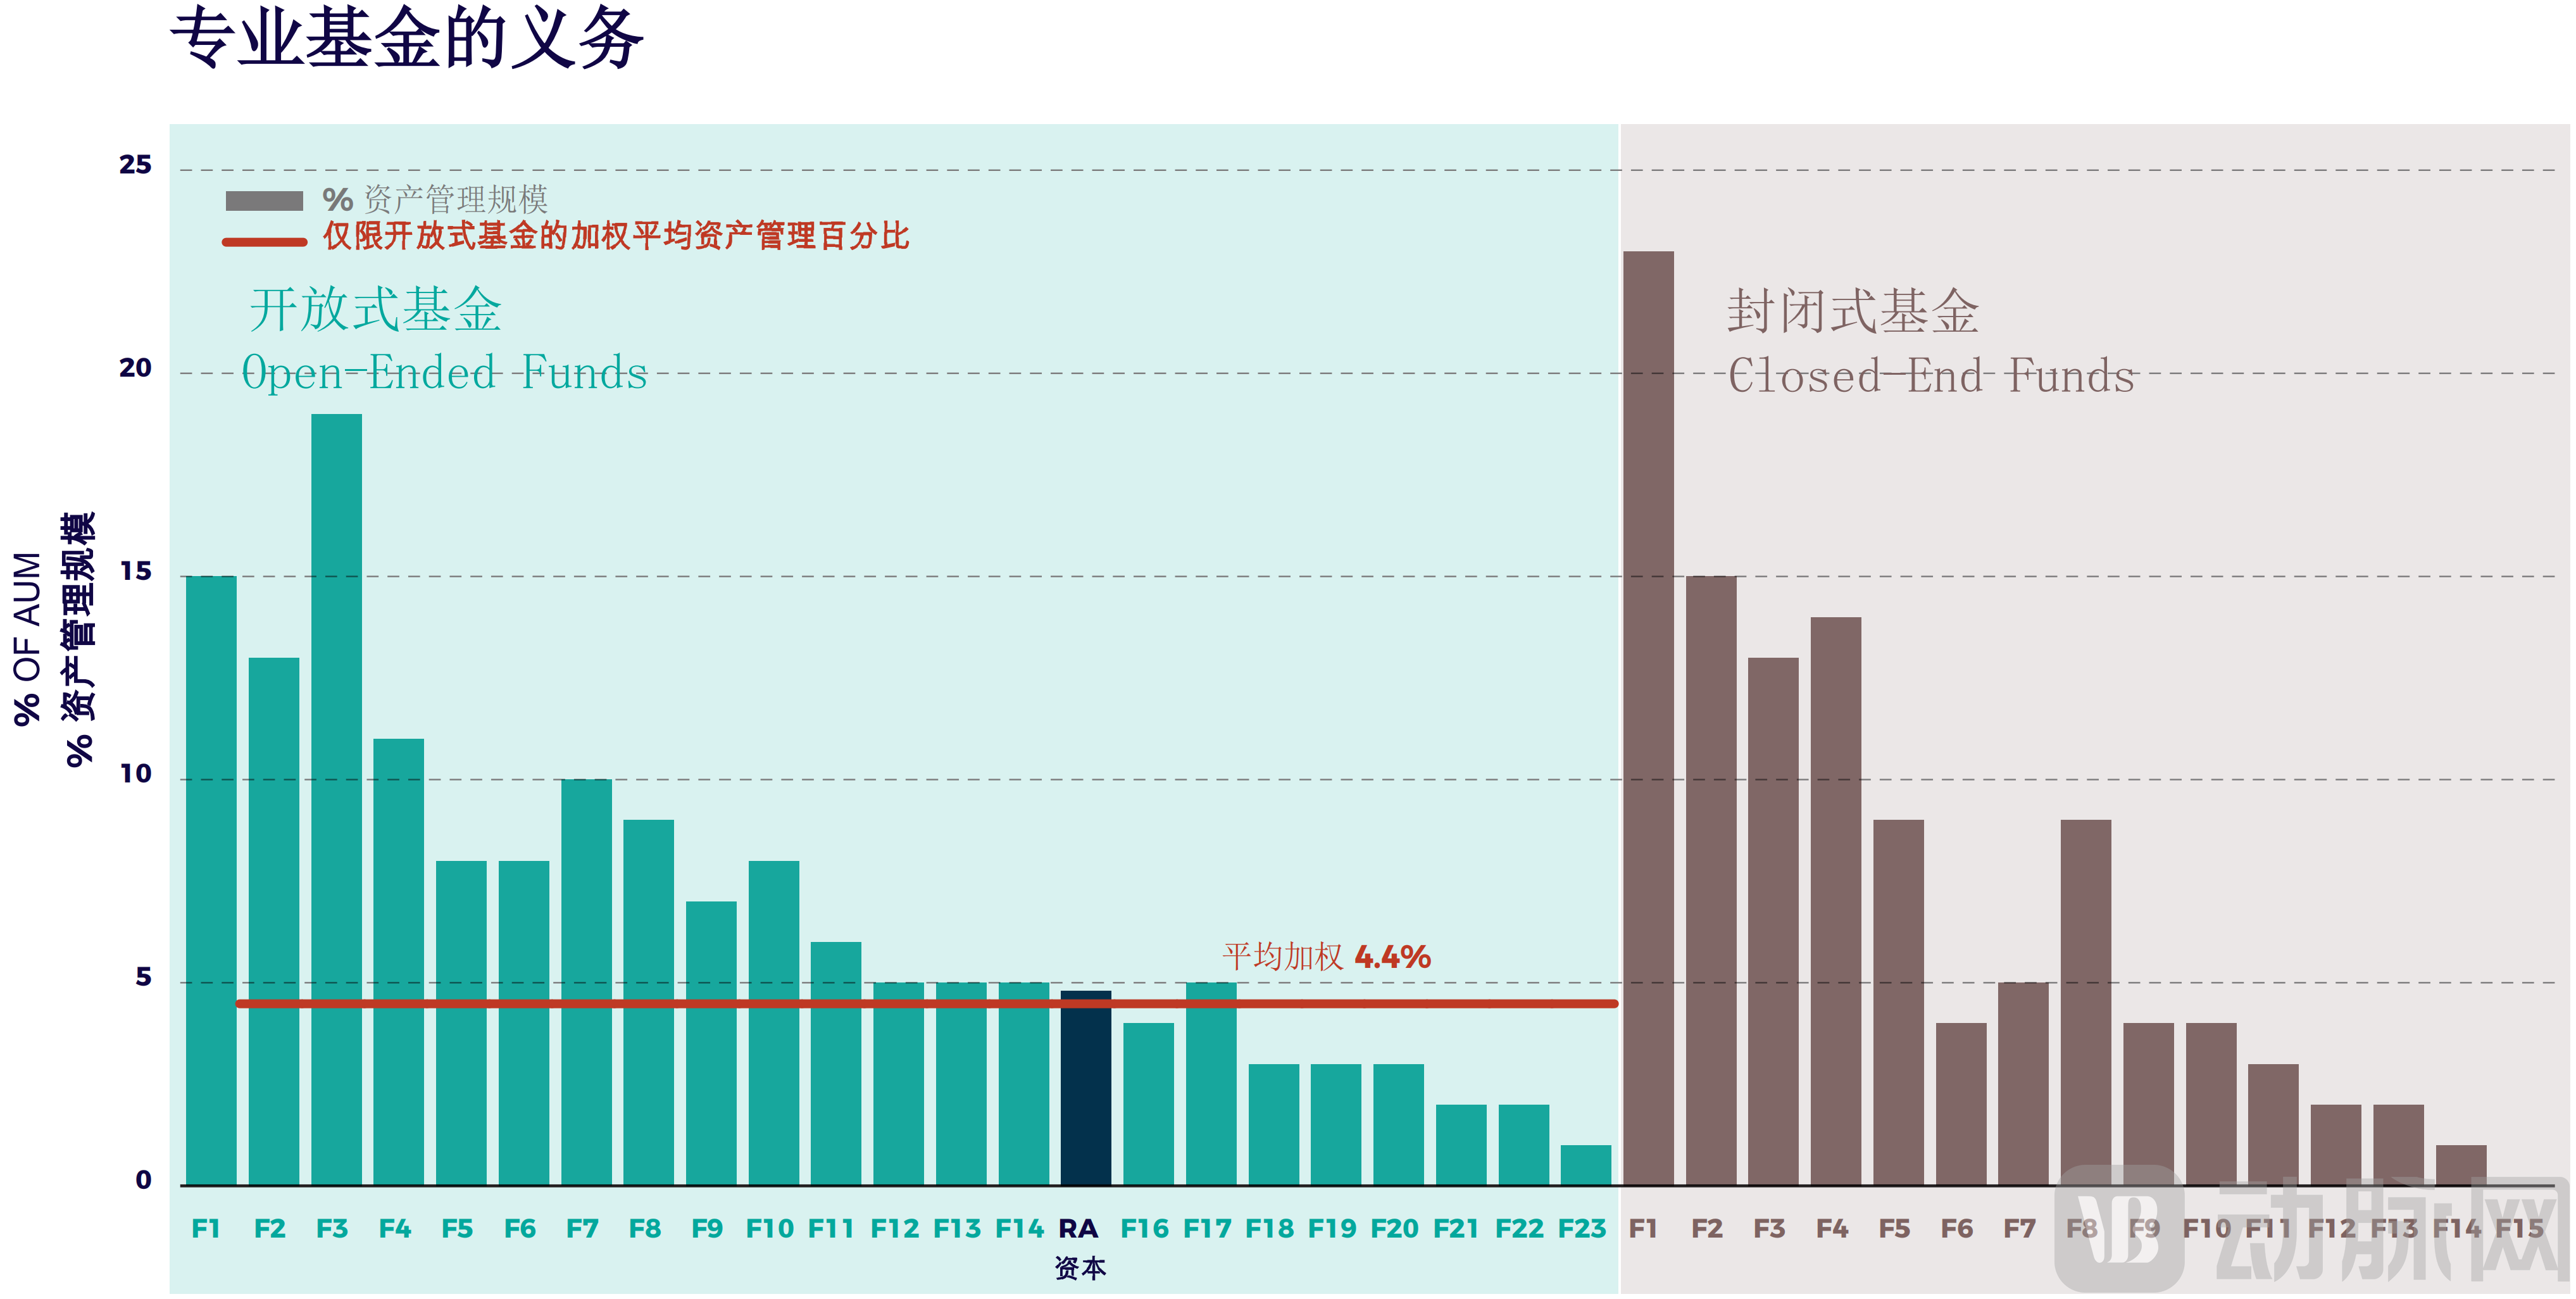
Figure 5: The Obligations of Professional Genetics
Open-end funds / Evergreen funds are displayed in the blue panel on the left, with a baseline of 4.4%, equivalent to their weighted average, highlighting data from RA Capital. On the right, we have excluded venture capital funds; because these funds have redeemable capital, their funding obligations are less significant relative to the total number of public equities they currently hold. For other funds, we limited our analysis to the latest 13F filing data (i.e., data as of 9/30/22), while using 2022 prices to calculate exposure.
Explore the open-end/evergreen funds in our professional fund portfolio,They require only 4.4% (weighted average) of the portfolios to meet the financing needs of all development-stage pharmaceutical companies in the investment portfolios that needed to raise funds in 2023.. Moreover, given that this process requires one year, selling only 1–2% of assets each quarter would generate the necessary cash.
Even if they are required to contribute a double share (for example, if management does not invest pro rata), undercapitalized biotech companies will not make overwhelming demands on the total size of specialized funds.
Some evergreen funds have weights skewed toward companies with more issues, but these are often smaller funds, which is why the weighted average (4.4%) is important.
Some of the cash required by open-end fund managers to provide funding for their existing portfolio companies comes from capital inflows from limited partners (i.e., their investors). Other cash is generated from the sale of existing assets, which may involve divesting failed projects or exiting successful ones when managers deem that a reasonable transaction price has been reached. Additional cash proceeds come from acquisitions involving their portfolio companies. It is important to note that companies do not raise capital solely from investors; some of their funding comes directly from strategic partners.
The bottom line is,Few, if any, professional investment institutions have seen the tsunami-like surge in funding demands coming their way.. This is more akin to a stable cash flow, which I believe most of our institutions can anticipate and manage.
Unless investment institutions spare no effort to rebalance their portfolios, tilting toward undercapitalized companies, financing risks will be automatically written down (a rather aggressive move this year). This is not because the economic downturn “ignores” robust companies, but because certain characteristics enable them to endure. A close examination of these core companies may gradually lead investment institutions to recognize what professional institutional investors—and even many generalist investors—already see: the presence of valuable drug candidates.
"If you don't trust investment institutions, ask the strategy departments of large pharmaceutical companies."
5Funding from Large Pharmaceutical Companies
When large pharmaceutical companies acquire firms in the R&D stage, the acquired entities are almost always core biotech companies (see Figure 6). We examined M&A activities since 2014,It was found that 98% of strategic investments were allocated to core companies—unprofitable pharmaceutical firms listed in the United States with market capitalizations below $10 billion, held by one or more specialized investment institutions.
Even if some acquired companies were not always core holdings, by the time acquirers recognized their value, one or more of our peer institutions had already purchased shares in these companies, thereby transforming them from peripheral to core holdings. It is worth noting that we carefully included only those shareholders who appeared on Form 13F filings prior to the announcement of the acquisition.
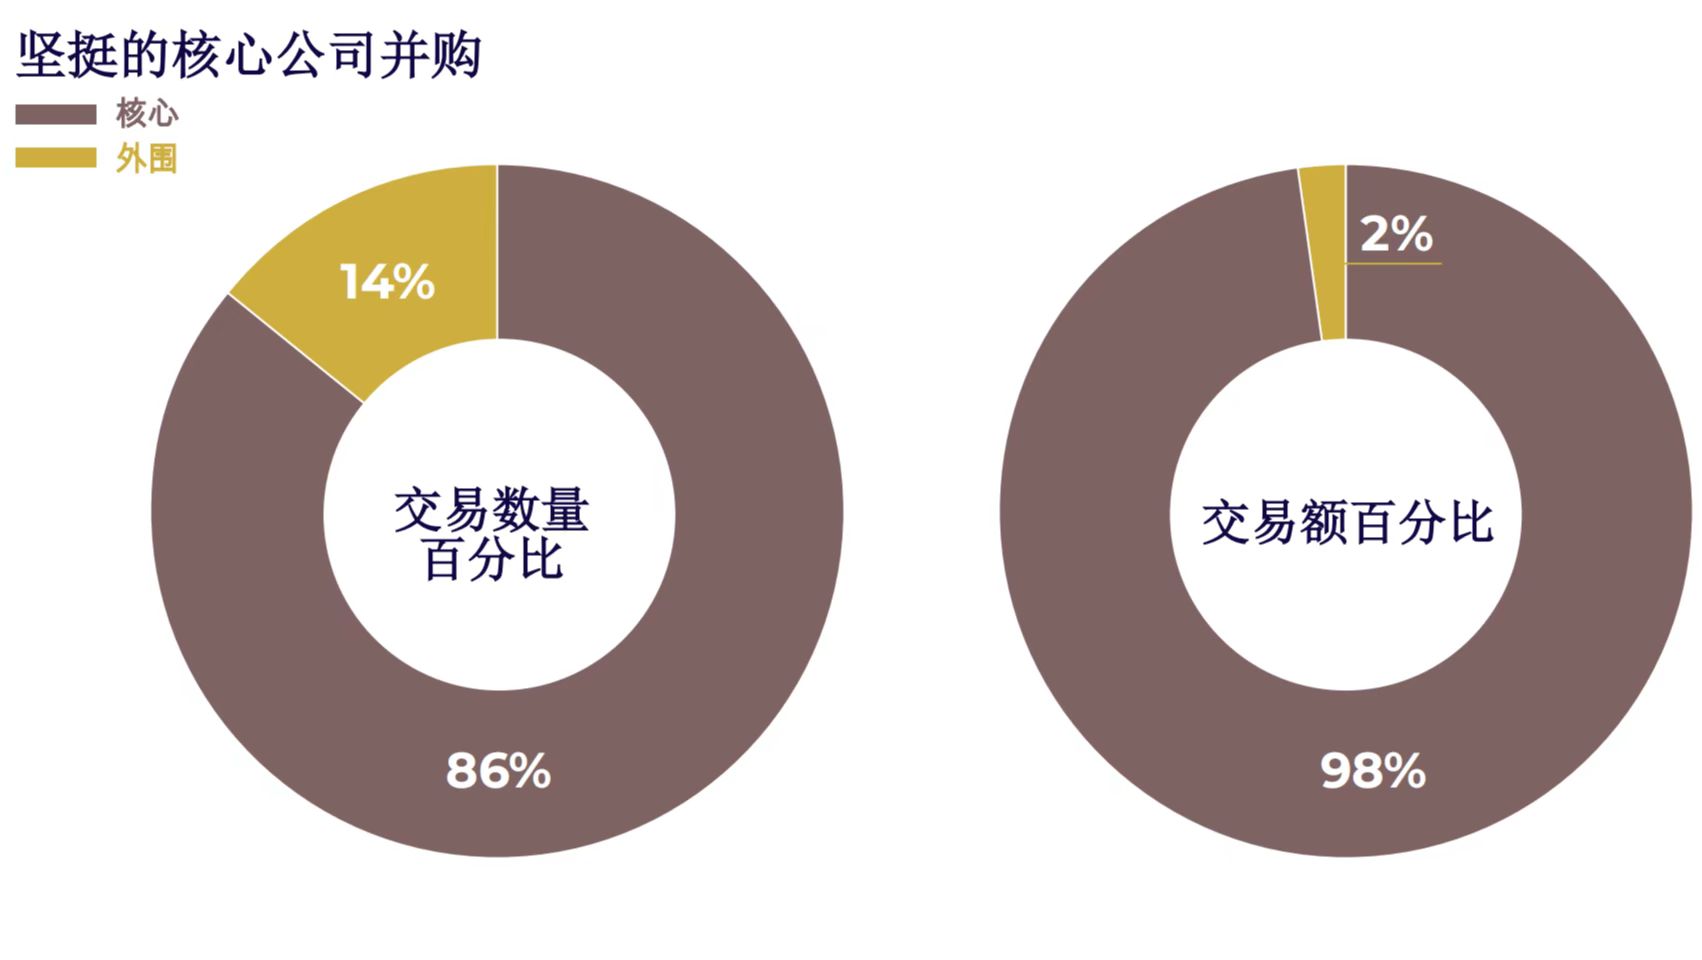
Figure 6 Mergers and Acquisitions by Leading Core Companies
Since 2014, core companies have demonstrated a significant advantage in mergers and acquisitions (M&A), whether measured by the percentage of transaction counts (left) or the higher percentage of transaction values (right). This implies that professional investment institutions either maintain continuous attention on nearly all core companies with acquisition potential, or they identify the acquisition value (e.g., robust clinical data) of nearly all peripheral companies before these are acquired. These figures are striking. The data exclude reverse mergers, as reverse mergers involving cash returns to shareholders do not constitute genuine acquisitions.
Some observers have stated that the level of mergers and acquisitions in 2022 was far below expectations, but this is not what we see in the data.Figure 7 shows that the level of mergers and acquisitions in 2022 remained consistent with historical trends.In U.S. dollar terms, 2022 was the fourth-largest year for M&A value in the past nine years. This may be because we excluded acquisitions of profitable companies, non-pharmaceutical companies, and those with market capitalizations already exceeding $10 billion. Please keep in mind that our objective is to evaluate M&A transactions that reward risk-taking during the development stage.
If the acquisitions of major companies such as Celgene and Alexion in previous years are not excluded, one could easily conclude that M&A activity in 2022 fell below standard. Consequently, it might be inferred that large pharmaceutical companies believe there are issues with today’s companies or consider them overvalued.
Note: If acquisitions of large, mature biotechnology companies such as Alexion and Celgene are included, the total acquisition value in 2022 approached the levels seen in previous years (if a pending transaction is counted) until mid-December, when news broke that Amgen would acquire Horizon for $28 billion.
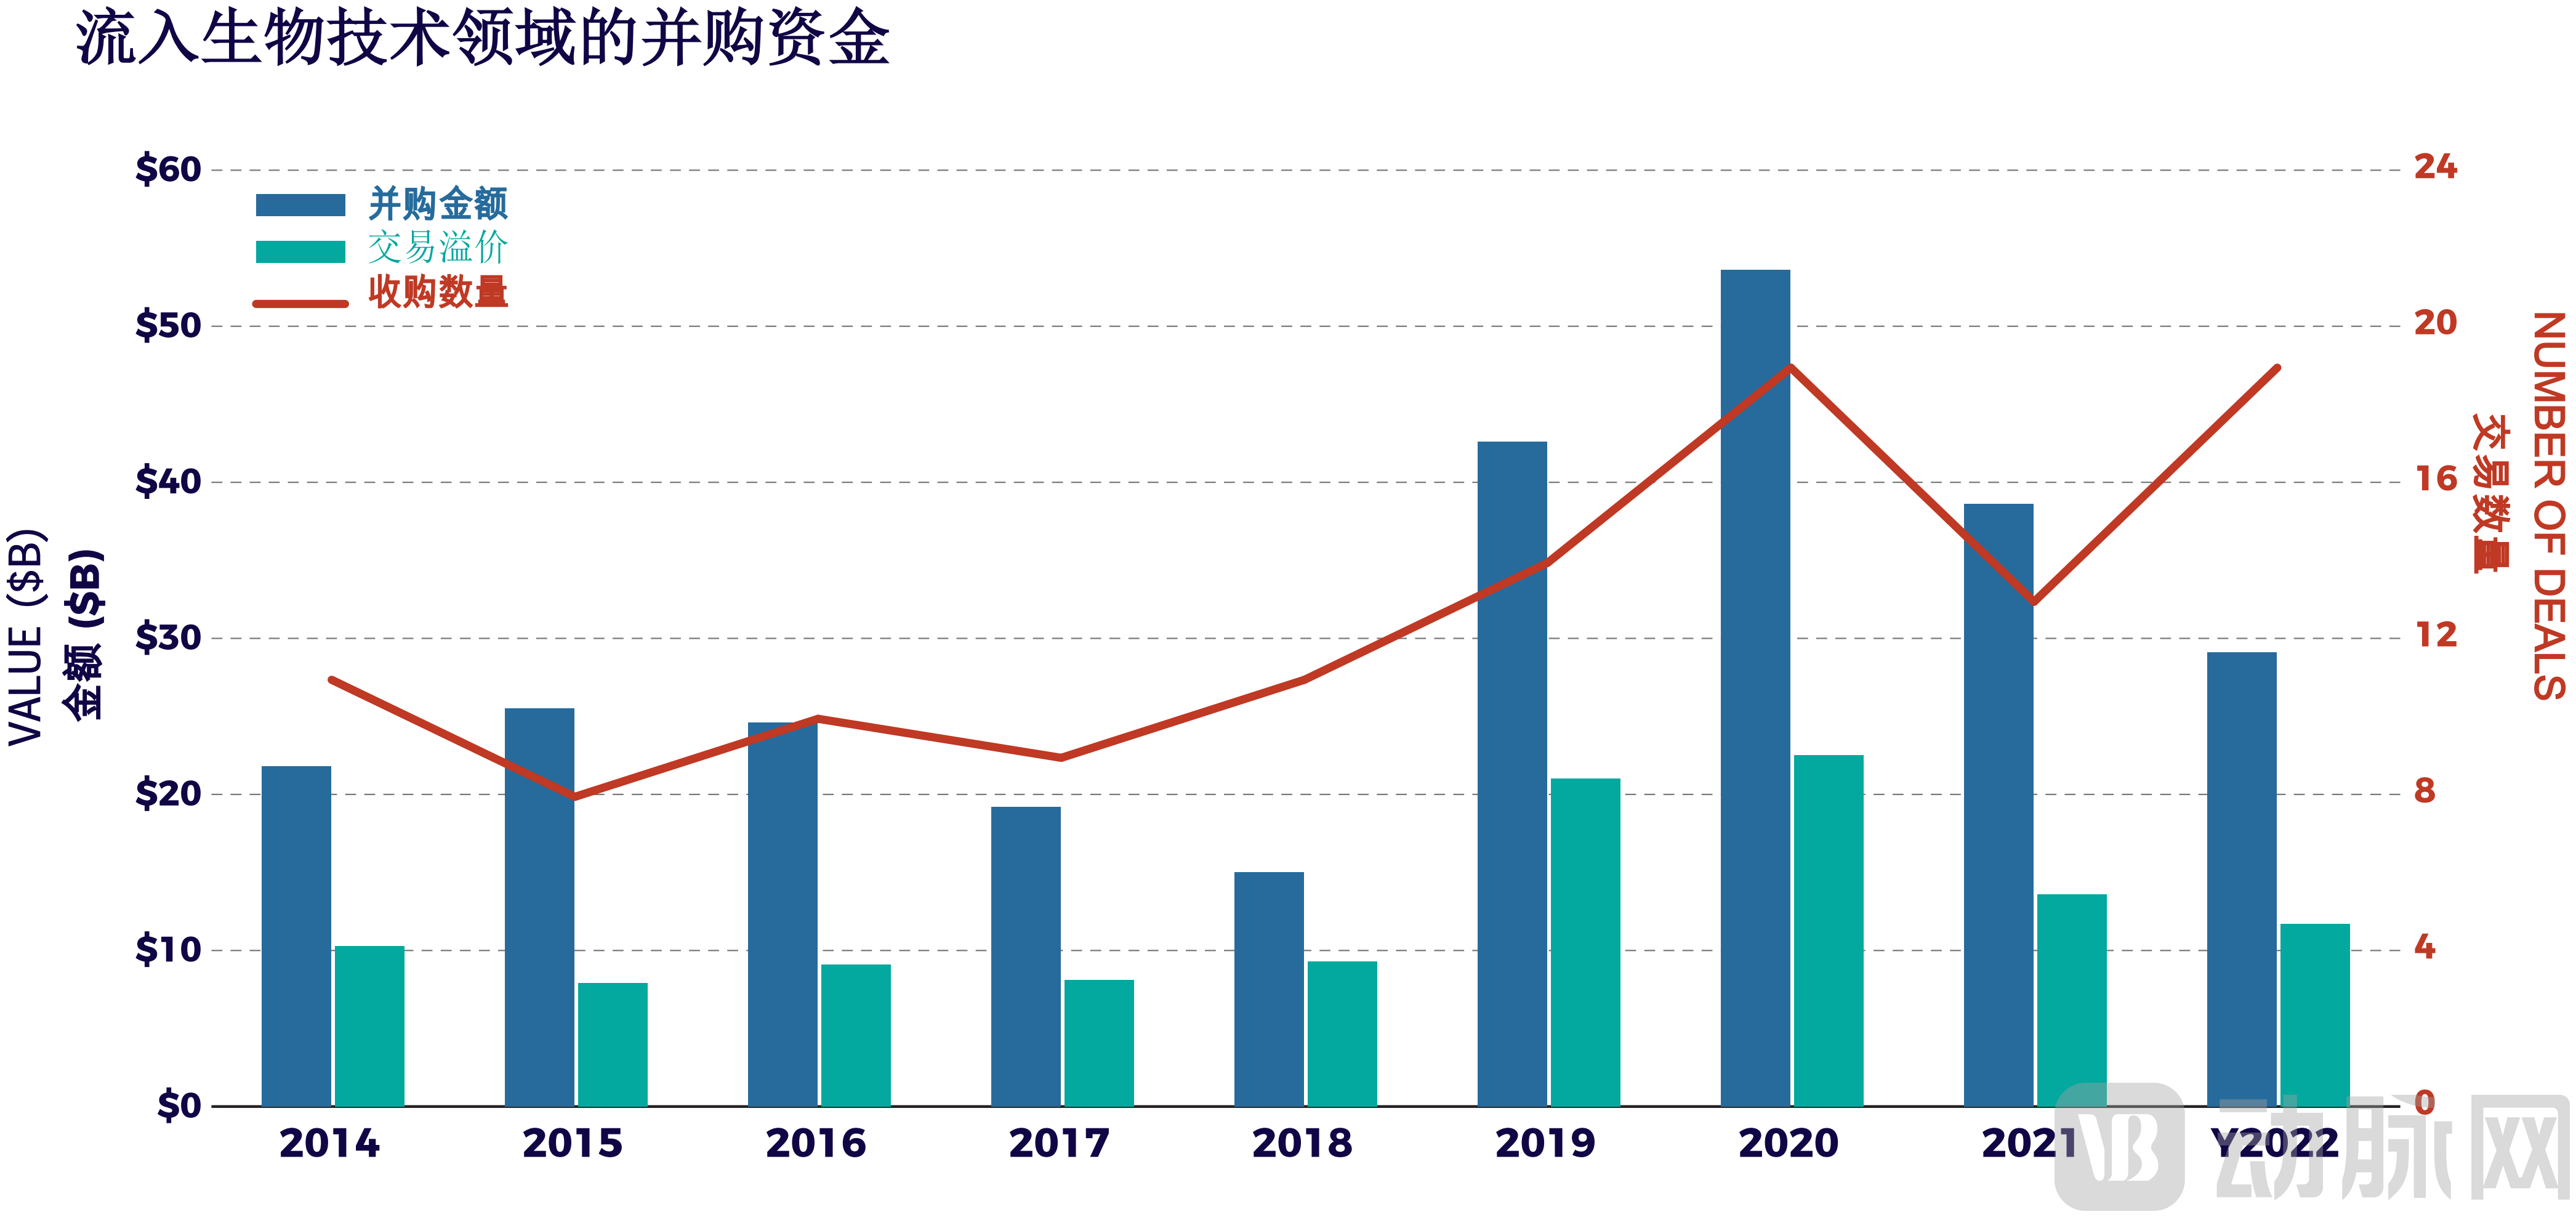
Figure 7 M&A Capital Flowing into the Biotech Sector Annually
Since 2014, the Strategic Investment Department has annually acquired publicly listed biotech companies in the R&D stage with market capitalizations (valuations) of $20–40 billion, providing investors with a continuous source of cash flow (transaction amounts, blue bars) and delivering returns (transaction premiums, green bars). To date, the nearly $30 billion in acquisitions we have observed represents more than 8% of the total market capitalization of core companies (this figure is derived from the decline in valuations in 2022). Transaction premium refers to the amount by which the purchase price exceeds the valuation on the day before the announcement of the acquisition.
Notably, the total transaction value premium in 2022 was slightly lower than that in 2021, whereas the M&A volume in 2021 was disproportionately high relative to the premium amount; this is because strategic investment divisions paid higher transaction premiums in 2022. Therefore, looking at gross transaction values alone is insufficient; net returns must also be considered. From a return perspective, stakeholders would prefer to see net returns correlated with the value reflected by the industry (see Table 2).
Out of curiosity, we analyzed the core M&A funds (accounting for 98% of total M&A funds) to examine their distribution across various market capitalization segments. Table 2 reveals a logical trend.Investors do not see significant returns from acquisitions of companies valued under $200 million, a group that includes most firms with unstable financing.However, as company valuations rise—reflecting strong execution capabilities and reduced risks associated with candidate drugs—they enter a valuation range from which the majority of strategic acquisitions originate.
Despite volatile returns, investors can expect low single-digit annual returns from M&A transactions alone for companies with market capitalizations ranging from $200 million to $10 billion. Although the number of M&A deals near the upper end of this range is declining, the returns on such transactions may be higher at the top end.
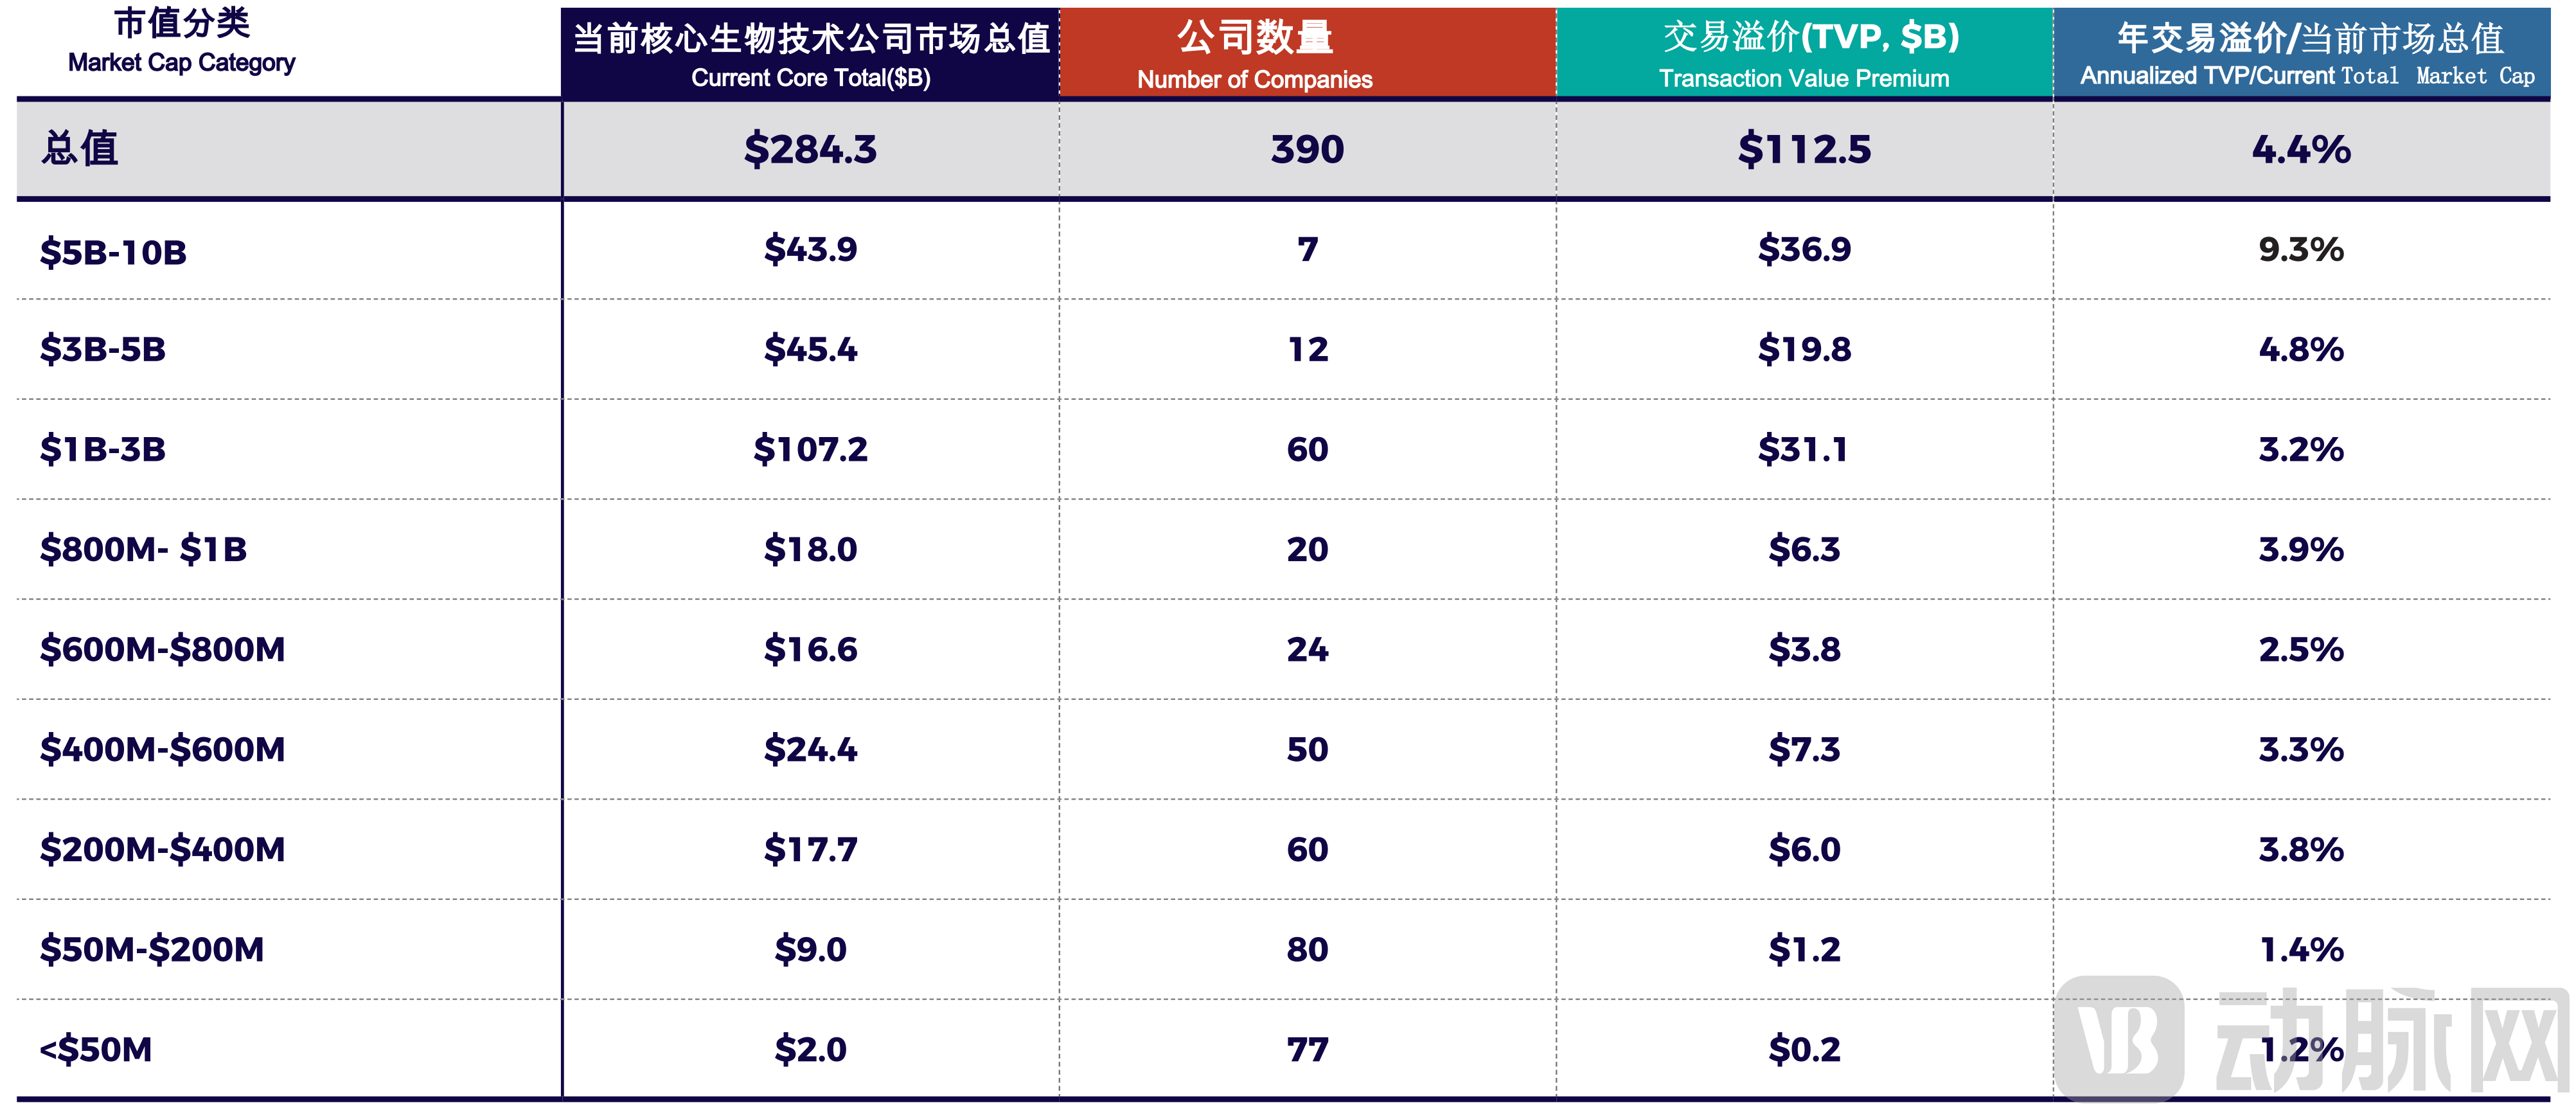
Table 2 M&A Funding Flowing to Core Biotech Companies Since 2014, by Market Capitalization
This table presents the total market capitalization of core biotech companies within each market cap range, along with the number of companies in each segment. “Transaction premium” refers to the amount paid above the market capitalization recorded on the day prior to the M&A announcement for companies in each market cap segment. Notably, as of 2022, seven companies fell within the $5 billion to $10 billion market cap range, contributing an additional $43.9 billion to the total market value. Since 2014, strategic investors have paid a cumulative premium of $36.9 billion for all acquired companies whose market capitalizations on the day before the acquisition announcement were between $5 billion and $10 billion. In the final column, we divide this premium by nine and then by the current valuation of the respective market cap segment to obtain a rough approximation of the annual return on current investment, assuming M&A trends persist.
Strategic acquirers are selectively purchasing core biotech companies held by specialized investment firms. However, if they so choose, the top 20 strategic acquirers could acquire the entire market—valued at $284 billion—at a 100% premium, leveraging their existing $220 billion in cash and annual free cash flow of $240 billion (accumulated in less than 1.5 years).
Of course, they will not do so. Not all companies are worth acquiring; a high cash-burn rate would drag down the acquirer’s earnings and reduce dividends. Core biotech companies remain a key source of future sales for large pharmaceutical firms, representing a small, low-cost segment within the larger M&A capital pool.
Each year, this capital pool is depleted by both successes (where acquired companies see rising profitability and valuations exceeding $10 billion) and failures (where companies exit the core group for various reasons, primarily due to clinical setbacks). However, over the past year, few new companies have replenished the core capital pool through IPOs or reverse mergers.
A large number of mature private enterprises will need to raise capital. Contrary to what general statistics suggest, specialized funds are not burdened by companies in financial distress and may even have room to add new core portfolio companies. Therefore, we believe it is only a matter of time before the most outstanding private companies (along with some others) secure funding.
Ultimately, the cross-conveyor belt will engage with the gears, and we will see a stable cluster of core companies, even if this cluster does not expand.In fact, even if more than 50 additional core biotech companies were added, each valued at $500 million, it would hardly change the scale of the core companies for professional investment institutions or strategic departments (increasing the cumulative market capitalization of the core companies by less than 8%).Moreover, since IPOs often leave companies well-capitalized, these firms face minimal financing risk for at least one year following their IPO.
Data indicates to our team that the biotechnology industry has weathered the downturn of the previous cycle and is poised for a resurgence.
We must now ensure that the operating system we use to restore operations for the next cycle has at least addressed some of the issues from the previous cycle. Although perfection is unattainable, we can always strive to do better.
Summary: Honesty and Efficiency: Making Our Value Proposition Known
I hope I have persuaded you—the foundation of the biotechnology industry is far more solid than overly broad statistical data might suggest. General statistics seem to indicate that investors are standing on the sidelines, awaiting an impending disaster. This is because such statistics focus on the number of struggling companies, which constitute a relatively small proportion within our industry.
As you can see, the number of mergers and acquisitions is well within the normal range. The substantial cash reserves held by large pharmaceutical companies dwarf the total valuations of core biotech firms, creating a favorable tailwind for future acquisitions of these key players.
We encourage investors to participate in IPOs by assuring them that they will not be deceived during the process, which will help bring more high-quality companies into the core resource pool. This is a lesson learned from the previous cycle. Another lesson is that every dollar counts; we can and should negotiate costs across the board, including D&O insurance, ATM fees, follow-on offering expenses, and clinical trials. We cannot continue the wasteful practices of the past in this new cycle. Let us make all our board meetings clear and effective, let us return to sound judgment, and let us truly fulfill our roles as corporate directors and executives. Our work is too critical to the company; they deserve more from us.
Finally, we must recognize that the Inflation Reduction Act (IRA) unfolded before our eyes because we overlooked its significance. We need to look up from the granular practice of funding innovation and strive to demonstrate our value proposition to the public and policymakers. We must communicate the value of medicine and showcase the societal value of new drugs. At some point in the next cycle, we will hopefully be able to amend the IRA. We also need to secure insurance reforms that make our products affordable for all patients.
Original Article Link:Semper Maior: Time to Reboot Biotech