Analysis of R&D Productivity and ROI Across 77 Public Biotechs Reveals Modest Returns Despite Higher Approval Rates
Entrepreneurs and investors alike seek to predict and identify drugs that are likely to gain regulatory approval in the future. However, it has proven difficult to select those therapies that will be profitable and deliver substantial returns on R&D investment. The good news is that there is ample room for improvement—industry standards still have significant potential to be enhanced, particularly in assessing commercial viability and improving capital efficiency.
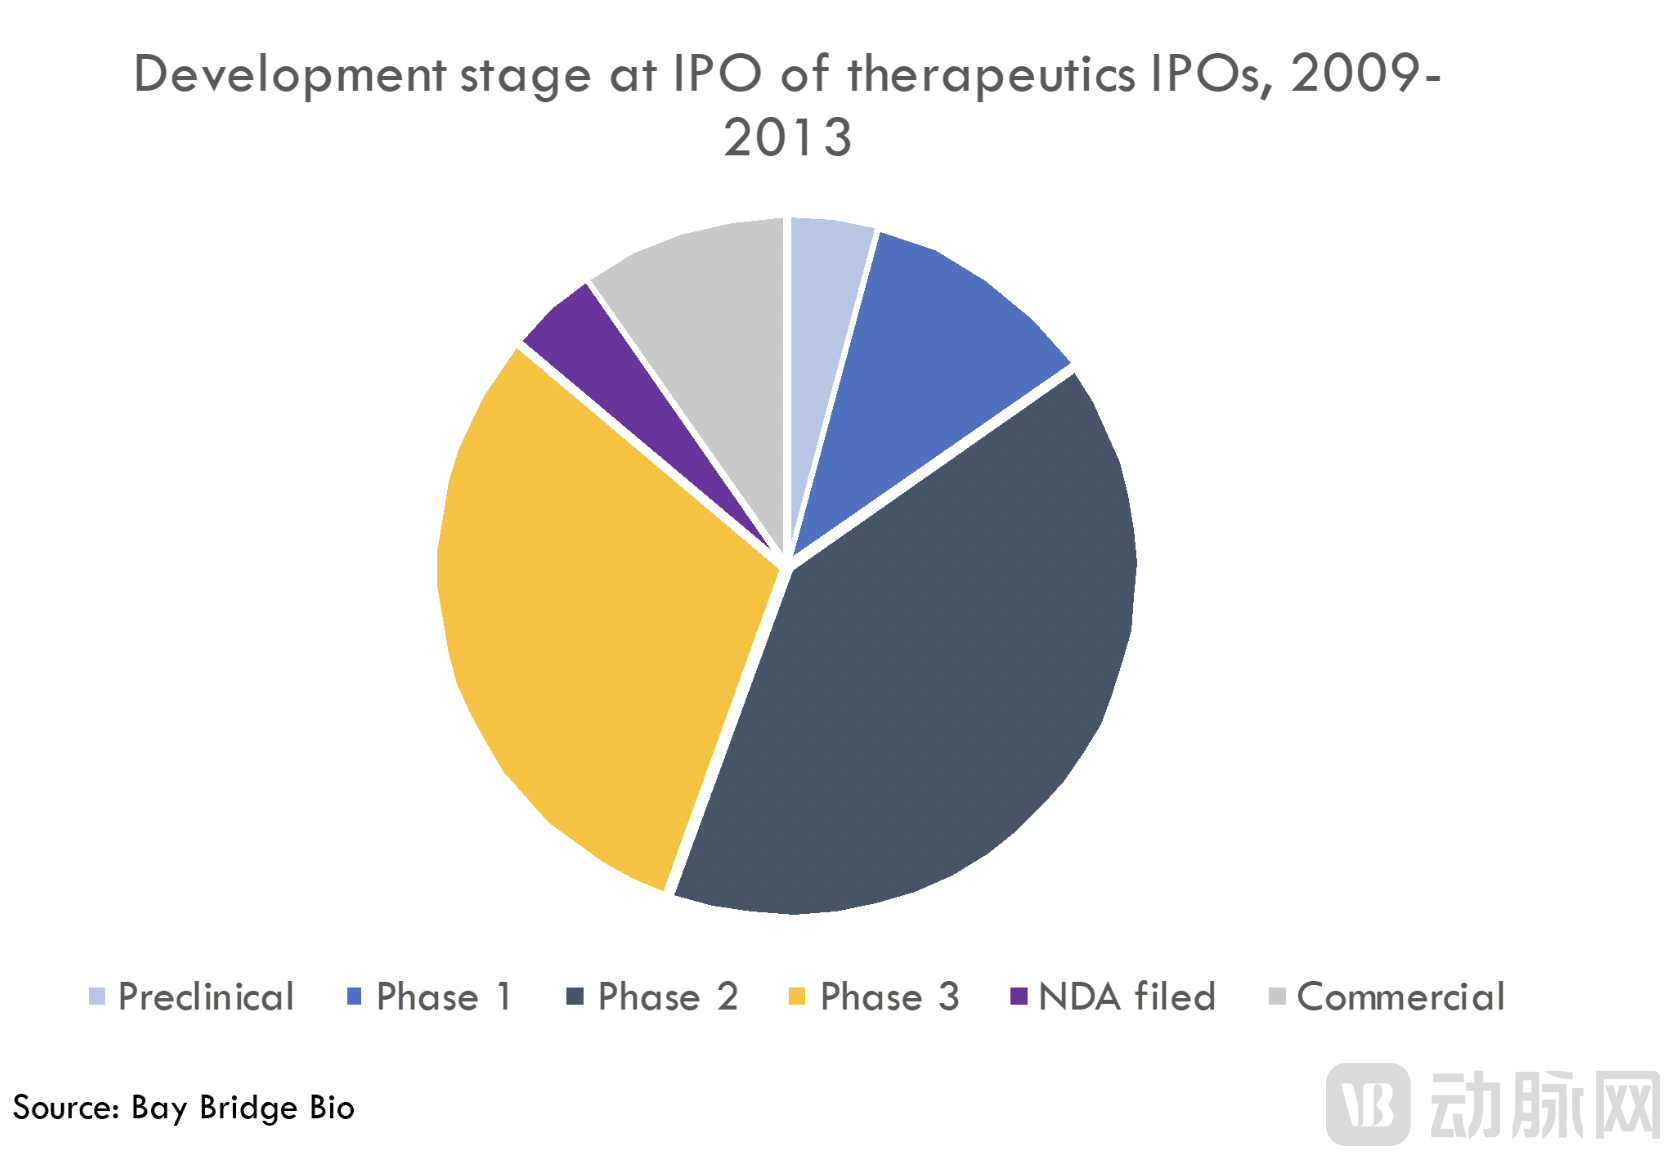
To understand the R&D productivity of startups,Bay Bridge Bio analyzed data from 77 startups that went public between 2009 and 2013.As these companies went public early and have since achieved significant scale,Actual revenue and the number of FDA-approved drugs can be used as evaluation criteria.
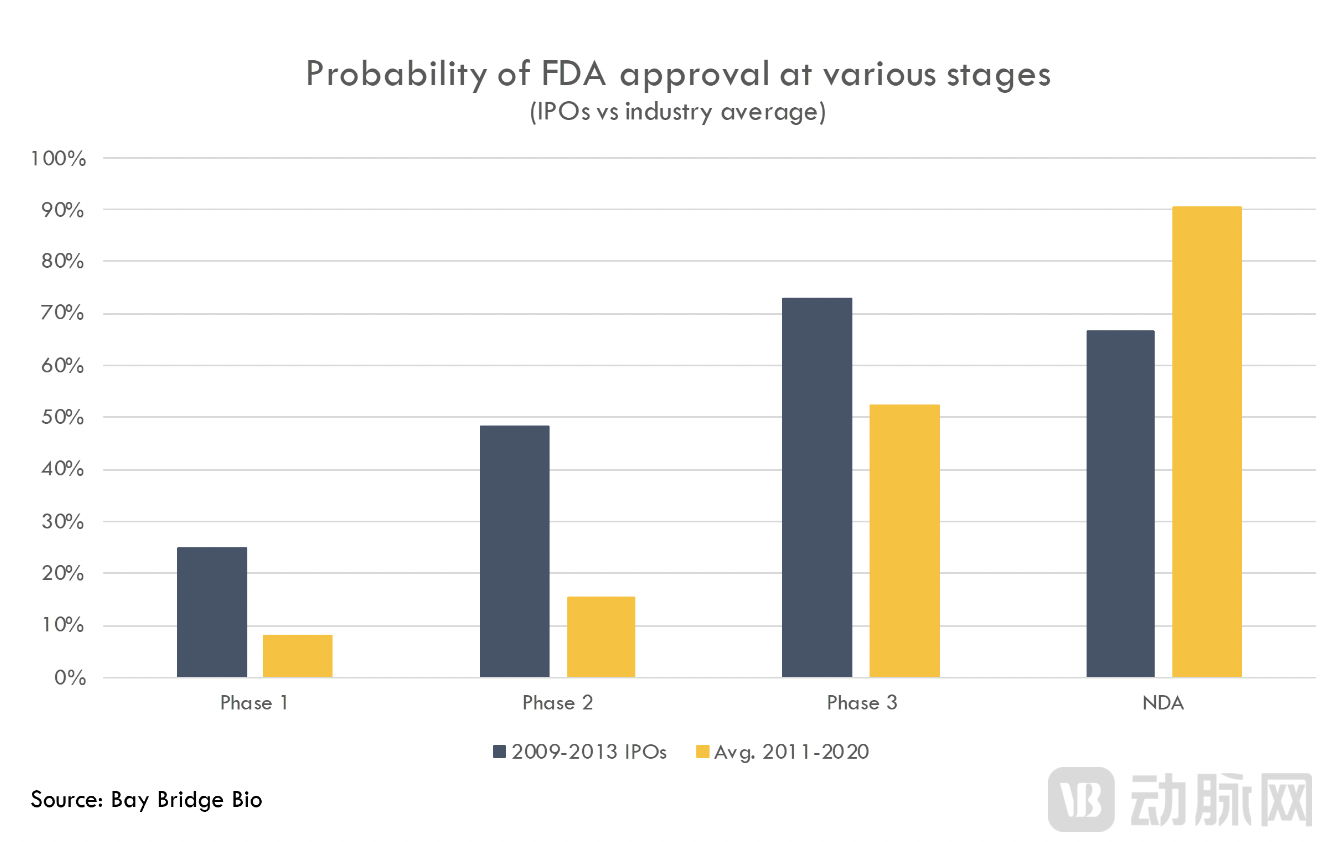
These companies achieved faster drug approval rates than their industry peers. Most of them held Phase II and Phase III assets at the time of their IPOs, with approval rates for these products exceeding the industry average (according to findings from the BIO, Informa Pharma Intelligence, and QLS Advisors report on clinical development success rates between 2011 and 2020).
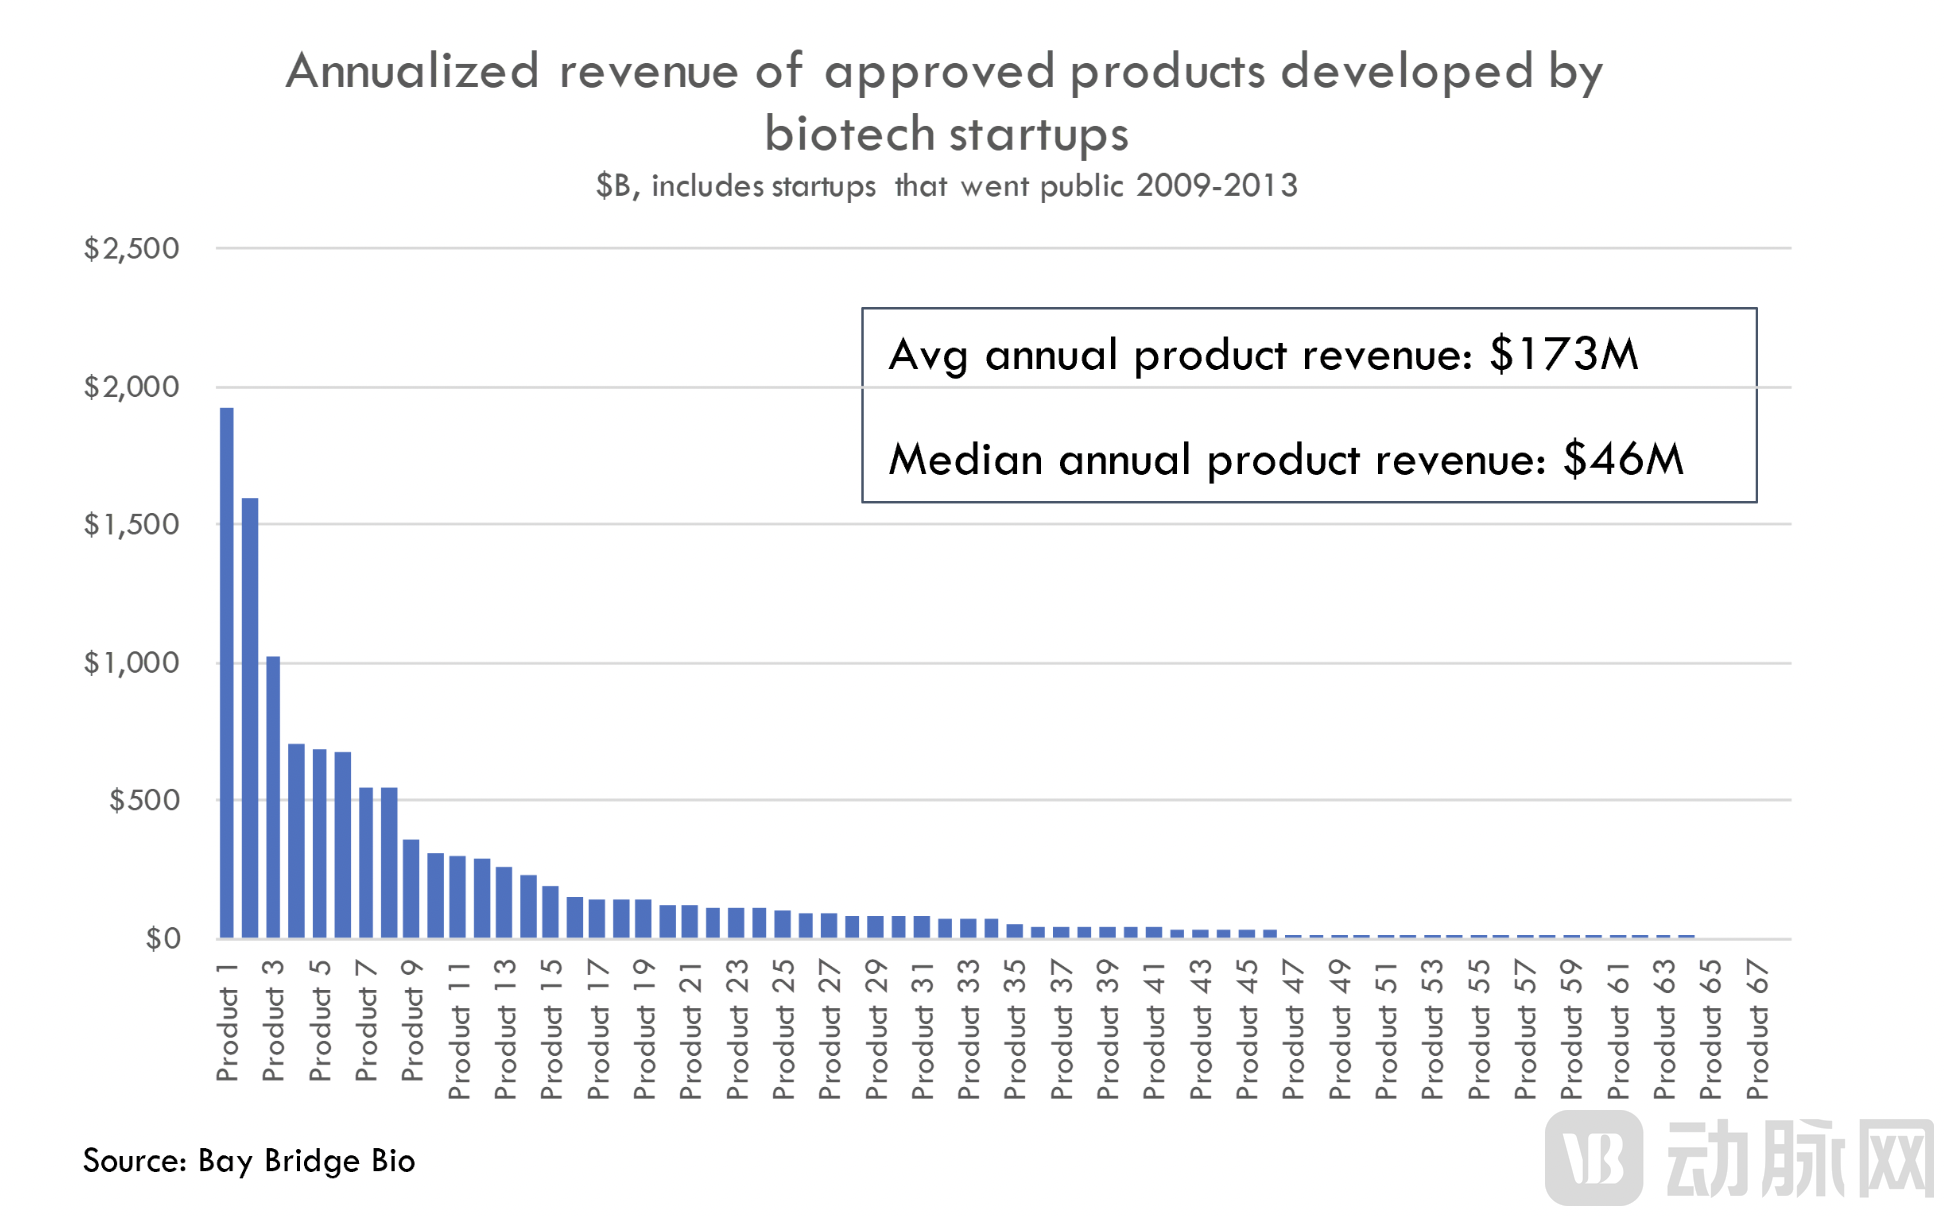
However, as of the fourth quarter of 2022, the average annual revenue contributed by FDA-approved products from this cohort of startups was only $174 million, with a median annual product revenue of just $46 million.If all products are included in the calculation, not just those approved, the average annual revenue is $125 million.
This appears to be below expectations; although there are some blockbuster drugs, the sales of many other products fell short.
How does the situation look when compared across the entire industry? Bay Bridge Bio cites Deloitte’s annual analysis of large pharmaceutical companies’ pipelines as a somewhat informal reference. Deloitte estimates that, as of 2021, late-stage products at large pharmaceutical companies (those for which Phase II clinical trial applications have already been submitted—similar to the development stage of the companies in the IPO cohort discussed above)The average peak sales volume was $521 million.. At first glance, the drug revenues of large pharmaceutical companies appear to be significantly higher than those of drugs developed by IPO-bound companies. However, due to differences in statistical methodologies,The figure of $521 million is certainly overestimated, while the figure mentioned above ($125 million) is definitely underestimated.. Therefore, we cannot draw many conclusions regarding the commercial potential of products from startups and large pharmaceutical companies.
The aforementioned figure of $521 million encompasses the projected peak sales for COVID-19 therapeutics and Aduhelm, the novel Alzheimer’s drug developed by Japan’s Eisai and U.S.-based Biogen, prior to its commercial failure. Consequently, this figure is undoubtedly inflated (due to Aduhelm) and reflects a one-time surge rather than sustained sales growth (due to the inclusion of COVID-19 drugs).In 2019, a more “normal” year, the estimated peak sales were $360 million.
Furthermore, Deloitte used estimated peak sales to represent R&D returns in its analysis. Although this is a logical calculation method, the forecast results tend to be biased upward. On the other hand, Bay Bridge Bio’s calculation of revenue data for startups was based on annualized revenue from the most recent quarter (Q2 2022) rather than peak sales.
1How Much Does It Really Cost to Develop a Drug That Successfully Reaches the Market?
When comparing drugs developed by startups with those developed by large pharmaceutical companies, regardless of which is more profitable, the remarkably low average annual revenue of startup-developed drugs can easily erode industry confidence. This is because drug development entails high costs, necessitating substantial earnings to recoup these significant expenses.
According to a Deloitte report, as of 2021, the cost for a large pharmaceutical company to launch a new drug stood at $2 billion (including costs associated with failed drug candidates). So, what is the situation for startups?Bay Bridge Bio estimates that the cost for a startup to develop an approved drug is $768 million.
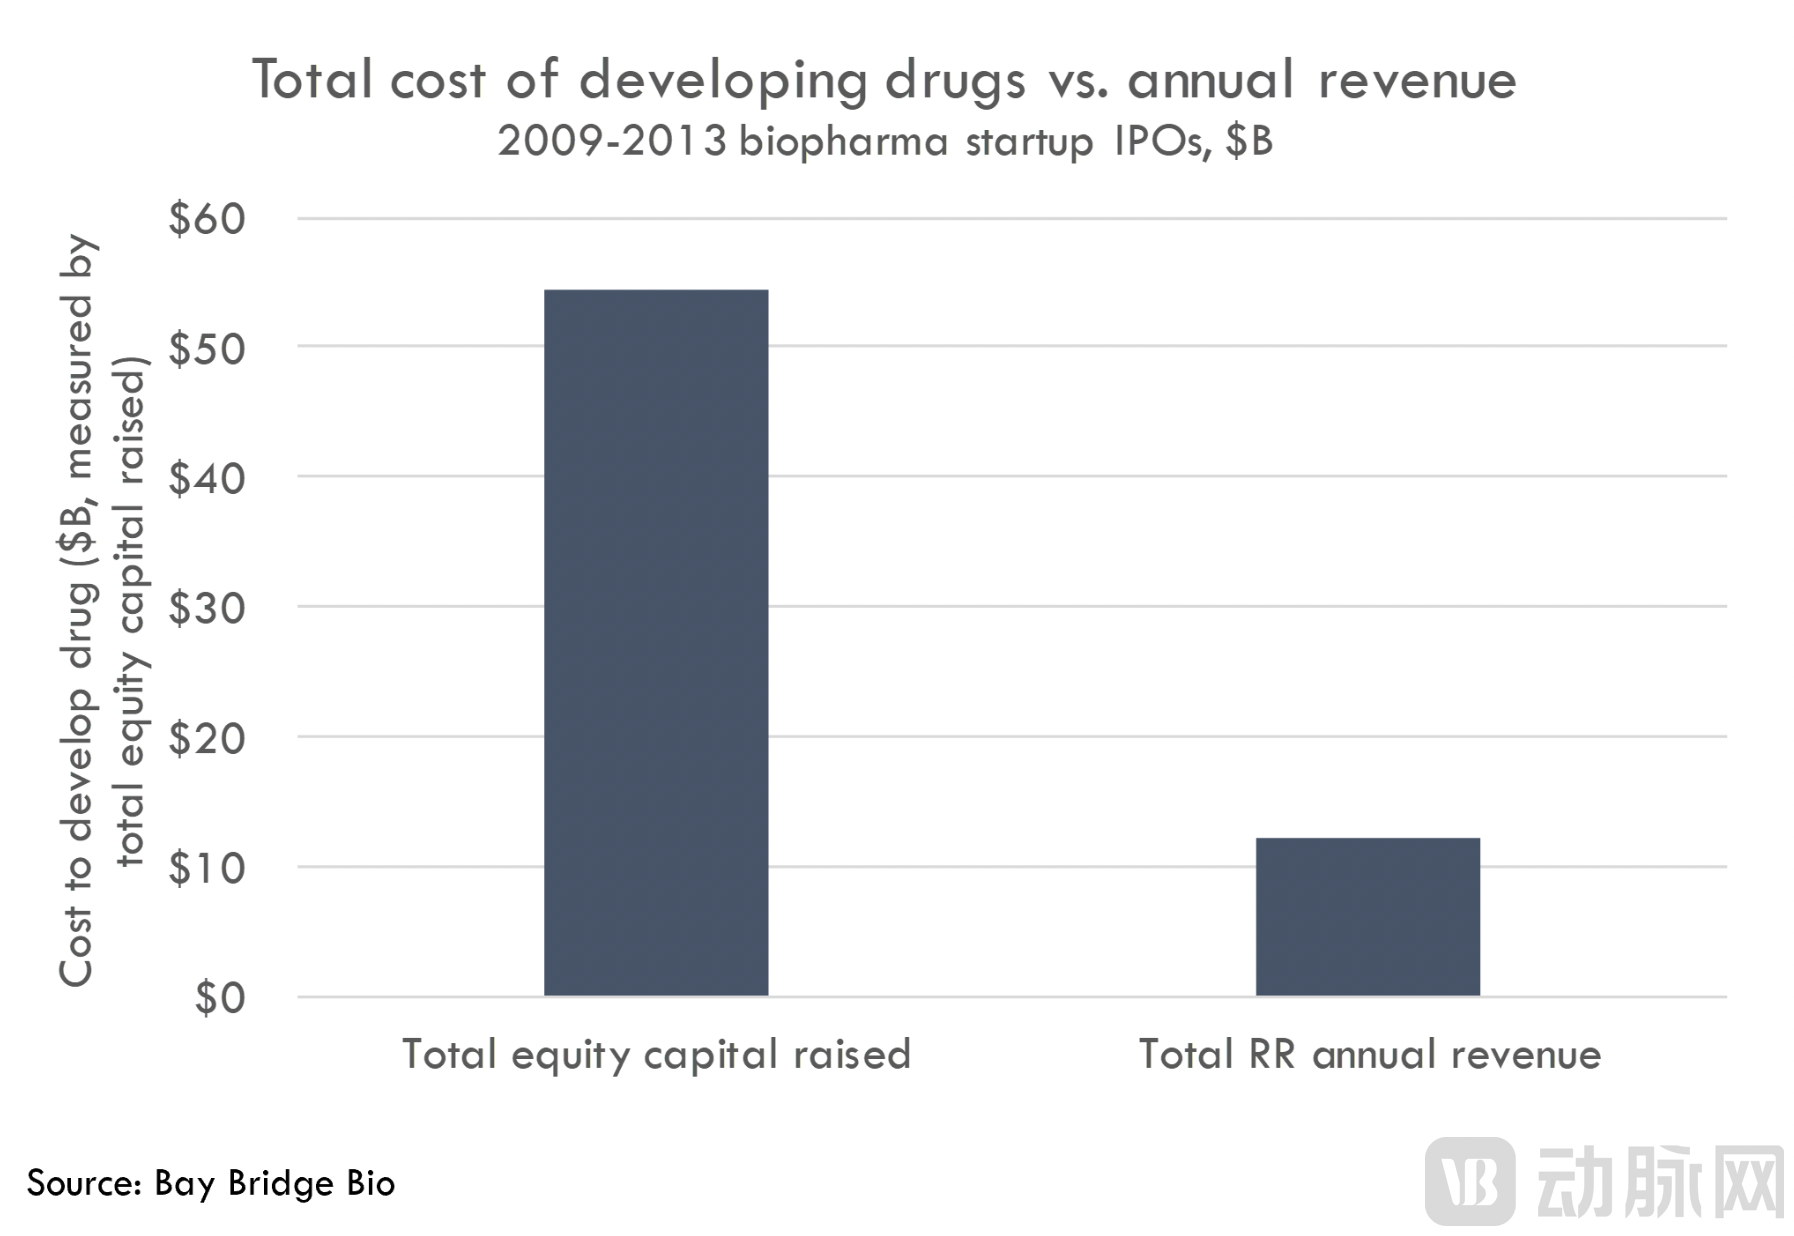
In the absence of cost data at the individual drug level for these companies, Bay Bridge Bio derived this figure by calculating the total equity capital raised and dividing it by the number of approved drugs. The results show that,UpA total of 71 approved drugs developed or licensed/acquired by the aforementioned IPO companies have consumed $54 billion in equity capital.This means that the cost per approved drug is $768 million.
Similarly, due to differences in calculation methodologies, the $768 million cost for drugs developed by startups cannot be directly compared with the $2 billion cost for those developed by large pharmaceutical companies. Therefore, it is an oversimplification to conclude that drug development costs for startups are merely one-third of those for large pharmaceutical firms.
Moreover, attempting to compare the R&D productivity of startups and large pharmaceutical companies misses the point. Large pharmaceutical companies have a low return on investment in R&D, while startups must perform better in R&D to prove their value and secure high-risk investments.
However, what insights can we gain regarding the R&D productivity of startups?
2What is the return on investment (ROI) for R&D?
Deloitte calculated the return on investment (ROI) for late-stage R&D investments by large pharmaceutical companies from 2019 to 2021, with ROI ranging from a low of 1.5% in 2019 to 7.0% in 2021.Given the aforementioned reasons, the 7.0% return on R&D investment in 2021 is clearly too high. Excluding COVID-19 drugs, the internal rate of return is expected to drop to 3.2%, and it will decrease further when accounting for the commercial failure of Aduhelm.
Is the R&D Return on Investment (ROI) for Startups Higher Than That of Large Pharmaceutical Companies? Preliminary Analysis by Bay Bridge Bio IndicatesStartups do perform better, but not by a large margin compared to large pharmaceutical companies—only by about 5–10%.
Bay Bridge Bio employs a simplified analytical approach. Since start-ups are in the R&D phase and have a limited number of clinical assets under development, the equity capital raised can be used as a proxy for the costs associated with drug development and launch. To calculate the returns generated from drug commercialization, Bay Bridge Bio uses the most recent equity valuation or the acquisition value to represent the future value derived from the sale of drugs.
Specifically, in its analysis, Bay Bridge Bio compared the current equity value of startup founding teams with the equity capital raised, thereby obtaining a metric for the “cash-on-cash” return for all equity investors in these companies. It then calculated the annualized rates of return implied by the “cash-on-cash” returns over a series of time periods.
These startups collectively raised $54 billion in equity capital, with their combined latest equity valuation (as of August 31, 2022) or acquisition value totaling $86 billion. This represents an approximate return on investment (ROI) of 1.7x on equity capital invested over their entire lifecycle (this figure stood at 1.5x during the market trough on June 14, 2022).
The 1.7x multiple here represents the upper limit of the “cash-on-cash” return, as a portion of the current equity value is held by management and employees rather than investors. Assuming that non-investor stakeholders own 20% of the company’s shares, the return for shareholders would be 1.4x. Since non-investor ownership in these companies has not yet been estimated, Bay Bridge Bio will use the 1.7x figure.
By setting a series of investment holding periods, we can calculate the annualized return represented by this “cash-for-cash” figure:
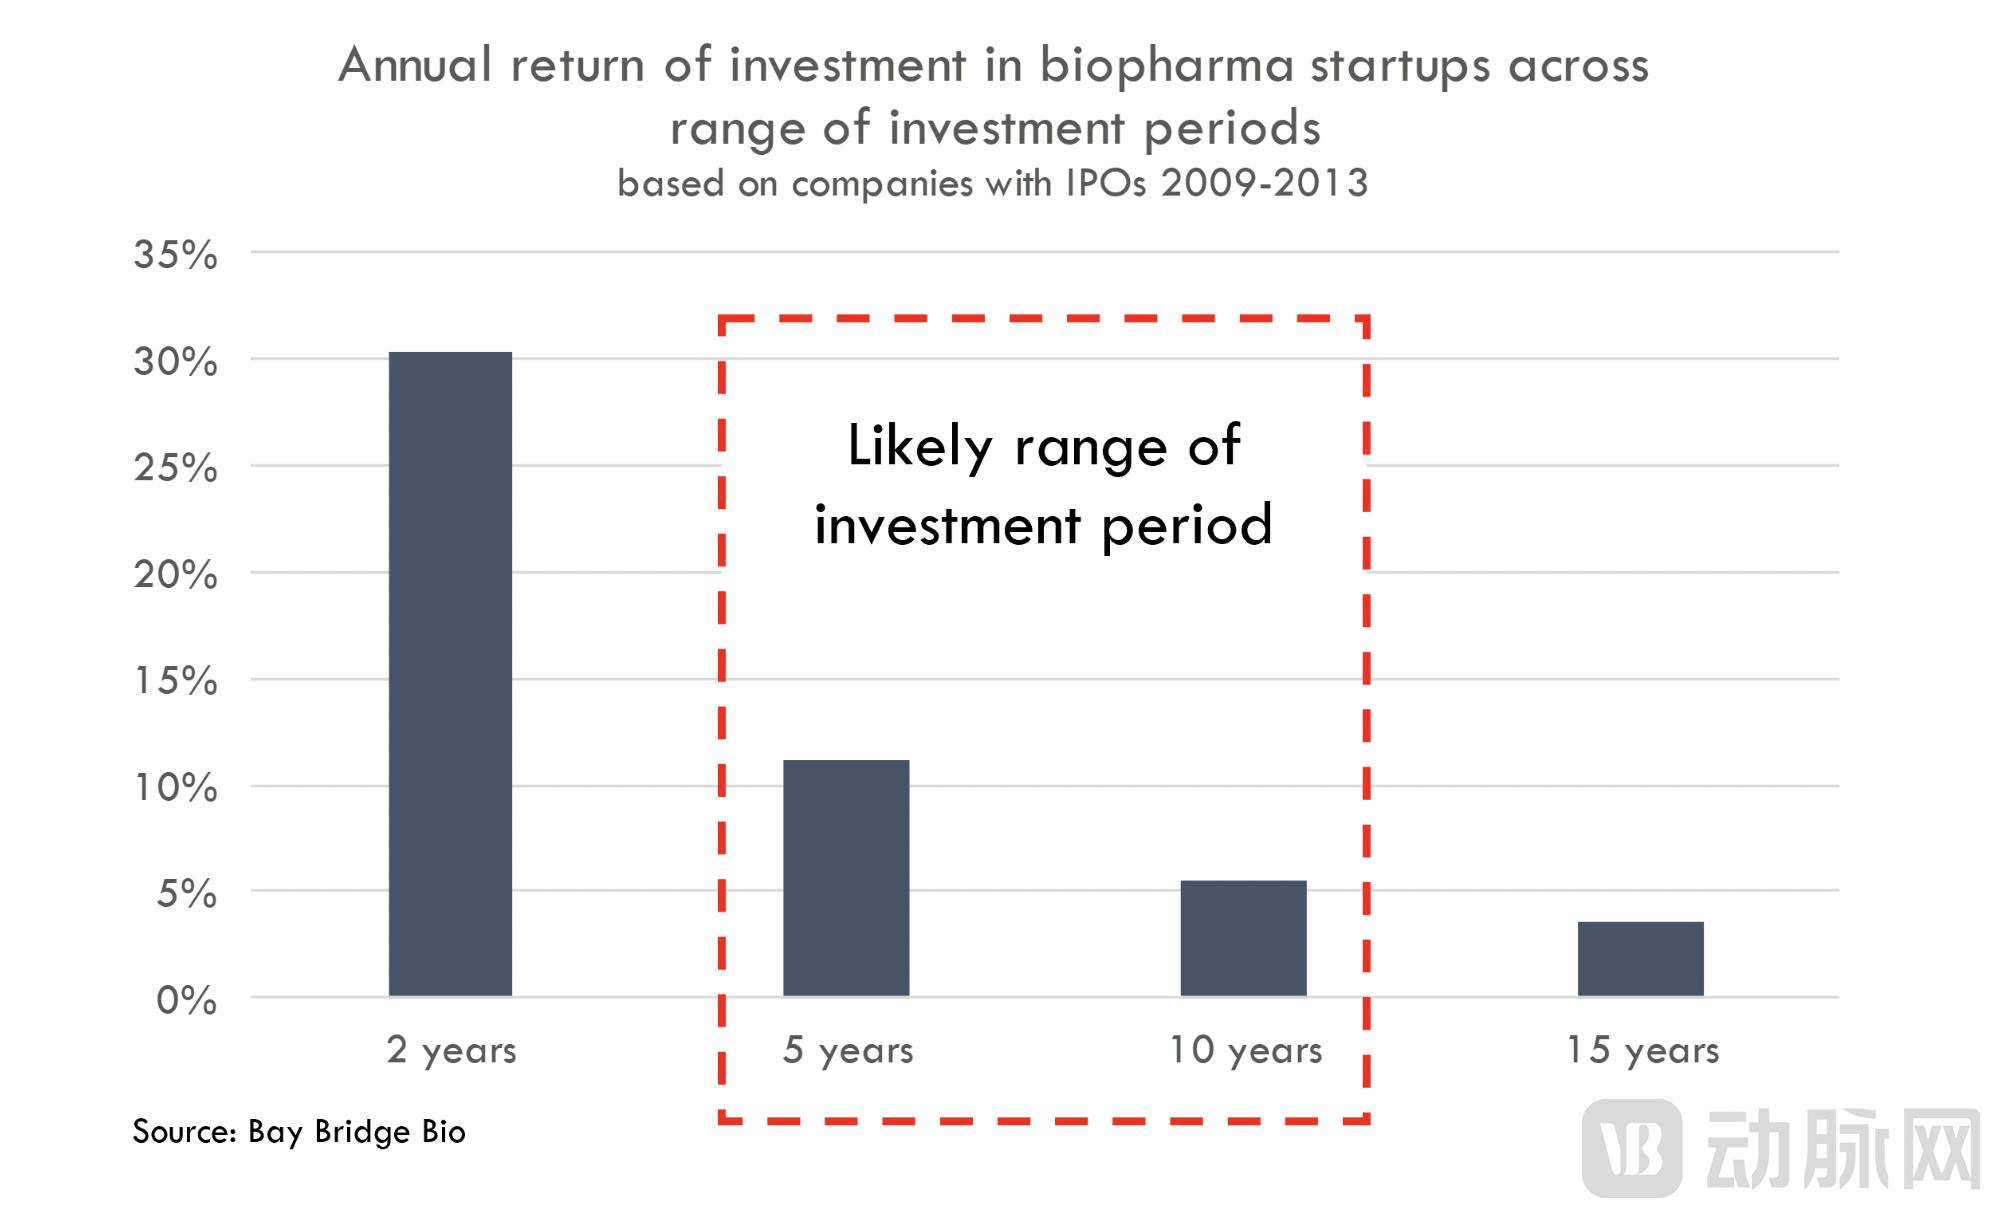
If $54 billion grew to $86 billion within two years, the annualized return would be 30.4%, a figure that is clearly excessive. These companies went public more than a decade ago, and their founding dates are even earlier.If the holding period is 5 years, the annualized return rate is 11.2%.A 5-year holding period appears to be closer to the actual holding period.
A 10-year holding period with an annual return of 5.4% is excessively long. Considering the companies’ listing timelines, they raised a total of only $11 billion after their IPOs. Therefore, the majority of capital was raised post-IPO. Consequently, these startups are likely to deliver annual returns of 5–10% to all equity investors over the course of their corporate life cycles.Compared with the S&P 500 Index’s approximate 15% annual return, the annual returns over the past decade have been somewhat lackluster.Moreover, the 5–10% figure overstates actual returns, as it is calculated based on a 1.7x cash-on-cash return that includes equity held by managers and employees.
By leveraging the total equity raised and market capitalization, Bay Bridge Bio was able to analyze the total value creation for all shareholders throughout a company’s lifecycle, which also serves as a robust proxy for R&D returns. To assess the long-term returns for early investors, one can simply examine the stock price changes from the IPO date to the present. Since their respective IPOs, the average return for new listings has been 123%, with a median of -64%. In comparison, the S&P 500 delivered a return of 257% from December 2009 to August 2022, and 118% from December 2013 to August 2022. In absolute terms, the returns generated by investing at the IPO price are closer to those of the S&P 500; however, on a risk-adjusted basis, these returns are inferior.
3Greater Attention Needed for Commercial Potential and Capital Efficiency
Investors and startups have done a decent job in improving the odds of clinical success, but this is far from sufficient.Prior to entering clinical trials, investors and startups need to pay greater attention to the commercial prospects of drugs under development.The costs of manufacturing and scale-up production (particularly in the fields of gene and cell therapy), pricing, logistics and distribution, and peer competition are all critical factors determining whether a company can achieve long-term success.
Bluebird Bio may be a typical example of how commercial factors can influence a company’s success. The gene therapy developed by the company was among the first to receive regulatory approval, with first-in-class potential and addressing an urgent unmet clinical need. However, due to its complex novel modality, it took billions of dollars in investment before finally gaining approval. Later, because of its high pricing, there was little commercial viability in European Union countries. Although ICER (the unofficial non-profit organization that evaluates the cost-effectiveness of new drugs in the U.S.) endorsed its $2.8 million price tag, payers’ attitudes toward this remain uncertain. Moreover, they are operating in a highly competitive market; despite being first-in-class, competitors quickly followed suit. So far, few investors or acquirers believe that the drug's commercialization will proceed smoothly. The company has raised over $4 billion, yet its current market capitalization stands at only $360 million.
The good news is that the Bay Bridge Bio analysis was limited to a cohort of companies that went public a decade ago. Any advancements in R&D made since then are not included in this analysis.
However, we can draw on the experiences of these companies to enhance R&D productivity.
Startups are focusing on improving trial design, leveraging supportive regulatory pathways, optimizing translational medicine and target validation efforts, and developing drugs for specific target patient populations to increase the likelihood of regulatory approval.Bay Bridge Bio believes there are compelling reasons to expect continued industry iteration, and this time we must refine how we assess the commercial potential of new drugs.
The fundamental approach to enhancing R&D productivity is obvious:Innovate production models, upgrade computational tools, and develop new technologies. However, merely “plugging” these technologies into the standardized frameworks and organizational structures of incubated biopharmaceutical companies is insufficient. Innovative companies must improve their internal decision-making processes and incentive structures, which have long contributed to R&D productivity falling short of expectations.
Specifically, Bay Bridge Bio believes that the following strategies will enable the company to achieve better long-term development:
Although leveraging validated targets and indications may facilitate fundraising, innovative companies should still avoid entering highly competitive therapeutic areas;
Conduct a comprehensive and in-depth assessment of the commercial potential of the project before determining the indication or project;
Conduct a more rigorous assessment of the project's competitive advantages;
When assessing the competitive landscape, consider how uncertainty in that landscape may impact the project’s development plan;
Improve capital operational efficiency (invest less in platform development, avoid reliance on specific products or partnerships, prioritize projects more rigorously, focus on differentiation from competitors, and enhance financial management capabilities);
While the above strategies may increase fundraising difficulties in the short term, they will help a company achieve long-term survival and development.
4Other Limitations of the Analysis
Bay Bridge Bio’s analysis is somewhat insightful, but it remains only a preliminary assessment.The survey results are also difficult to generalize to a broader sample of companies. Previous surveys have found that, compared with large pharmaceutical companies, startups achieve more drug approvals per dollar of R&D expenditure. Bay Bridge Bio’s analysis further validates this conclusion: startups secure drug approvals faster and at a lower cost per approved drug.
Despite numerous advantages, the fact remains that the overall return on investment in R&D for startups is relatively low. In the face of Eroom’s Law and the decades-long decline in R&D productivity within the industry, the increase in approved drugs has not been sufficient to revitalize R&D.
Another limitation is the failure to measure peak sales, relying instead on only the most recent annualized quarterly revenue. Consequently, this approach underestimates the potential and revenue generation of certain drugs. Most notably, the following new therapies were excluded from Bay Bridge Bio’s revenue calculations: bluebird bio’s first gene therapy for sickle cell disease and beta-thalassemia; Acceleron Pharma’s lead candidate, sotatercept; and ChemoCentryx’s tavneo, a treatment for ANCA-associated vasculitis, an autoimmune disease. Furthermore, given the early stage of these startups, these novel products may take more than a decade after the IPO (and even longer after company inception) to generate meaningful revenue. As a result, the discounted value of these products to early investors is significantly lower than it would be if the products had reached the market earlier.
Although we cannot adjust the average revenue data for unlaunched drugs, we can examine month-over-month growth to assess whether launched products are approaching their revenue peaks:
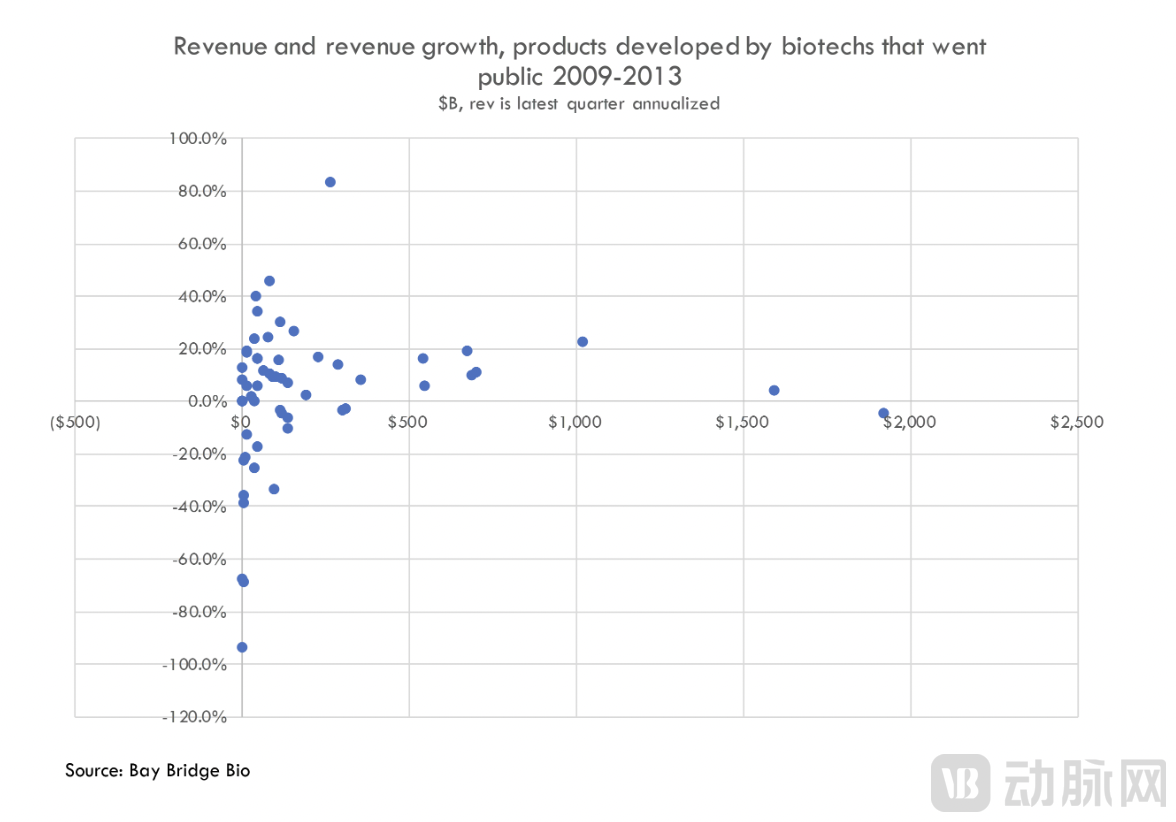
Among them, 15 products generated revenues above the average (annual revenue exceeding $170 million). Of these 15 products, two achieved quarterly growth rates exceeding 20%, eight recorded quarterly growth rates above 10%, and two posted annual revenues surpassing $100 million with quarterly growth rates exceeding 20%. All of these products demonstrate the potential to become blockbusters.
Another major limitation is that the timing of investments was not taken into account. We used an annual return rate based on a 1.7x cash-on-cash return as our benchmark, but this is a very rough analysis. As the company’s commercialization deepens—with expanded manufacturing scale, development of commercial infrastructure, and conduct of large-scale Phase II/III clinical trials—larger capital injections will occur. These later-stage investments carry lower risk and therefore demand lower returns. If a significant portion of the $54 billion raised is allocated to low-risk activities, the overall return on all invested capital would be less concerning.
The analysis has other limitations. Bay Bridge Bio’s analysis focuses on a cohort of companies founded more than a decade ago, whereas newly established companies, benefiting from more advanced technologies, may demonstrate superior data performance. However, these newer companies may exhibit lower capital efficiency, and competition for financing is likely to be more intense due to the previously pronounced bubble in the funding market.Therefore, it is highly necessary to conduct a similar analysis of newly established startups.
This can be described as a preliminary and insightful analysis, and there is significant value in further exploring these issues.
Reference Article:
Diagnosing the problem with biotech R&D,Bay Bridge Bio