RA Capital's 1H23 Core Biotech Report: Strong M&A Returns Signal Renewed Investor Confidence Compared to 2022
Early this year, ahead of the annual J.P. Morgan Healthcare Conference, RA Capital published a 41-page analytical report titled “Semper Maior: Time to Restart Biotech.” VCBeat News provided an immediate translation (RA Capital Partner’s Open Letter: The Darkest Hour Has Passed; It Is Time to Restart the Biotechnology Industry), which also sparked significant response and discussion among readers.
In its January 2023 analysis report, “Semper Maior: Time to Reboot Biotech,” RA Capital indicated that the biotech sector in the development stage had found its footing after enduring the industry’s longest and most challenging downturn. In this first update to that analysis, RA Capital is pleased to report that the foundations of the development-stage biotech industry remain solid.In the first half of 2023, biotechnology investors secured substantial returns from mergers and acquisitions (M&A) activities and have redeployed a portion of these funds into a cohort of development-stage companies that, while currently smaller in scale, command high valuations.
Typical industry analyses focus on a company's performance over a past period.(For example, as of June 30, XBI had risen by only 0.2%, despite fluctuating by 10% in the first half of 2023.) Alternatively, emphasis may be placed on the number of distressed companies trading below cash value (a situation where a company’s market capitalization falls below its cash on hand; according to our analysis, 25% of publicly listed biotech companies in the development stage trade below cash value), or on how many biotech companies may need to raise financing next year (accounting for 72%).
However, by studying the subset of biotech companies that are truly significant in the portfolios of specialist investors (in the first analysis, RA Capital divided the biotech universe into core biotech companies and peripheral companies not held by specialist investors), and weighting them based on their valuations,we can gain a clearer and more hopeful perspective on the prospects of our industry.
On July 1, at the outset of the second half of the year, RA Capital released the second article in its Semper Maior Biotech Series, titled “RA Capital's 1H23 Core Biotech Report,” which integrates an analysis of the market conditions during the first half of the year.The first update has been made to the various analyses in the first article.
From RA Capital’s analytical perspective, the number of core biotech companies decreased by 10% during the first half of 2023, while the total market capitalization of the core segment remained largely unchanged. During this period, cumulative cash burn decreased by 5%.
More importantly, since Legend Biotech and Apellis Pharmaceuticals exited our core biotech universe as their valuations climbed above $10 billion, $52 billion has been returned to core shareholders through acquisitions of 15 companies. Otherwise, this amount would have also been included in the core market capitalization scale. (In the first analysis, to avoid underestimating the risks in the biotechnology sector, RA Capital excluded five unprofitable core biotech companies with market capitalizations exceeding $10 billion, including Alnylam, Seagen, Beigene, Argenx, and Sarepta.)
Finally, the number of core biotech companies in the financing danger zone (those with less than two years of cash runway and a burn rate-to-market cap ratio exceeding 25%) decreased from 169 to 152, yet they still account for only 10% of the total market capitalization of core companies.
VCBeat has translated the full text, as follows:
Understanding RA Capital's Semper Maor Biotechnology Industry Analysis
In the first article, we analyzed all unprofitable, cash-burning biotech companies in the development pipeline, categorizing them into core biotech firms (those with at least one professional institutional investor) and peripheral companies (those without any professional institutional investors). We then further assessed whether they were in a high-risk financing zone.
Importantly, we examined the weighting of companies in the “danger zone” and other categories (such as those trading below their cash value) relative to the entire core universe of companies. This demonstrates that although there are hundreds of distressed firms, their aggregate weight within the industry is minimal. In other words, they have already been significantly written down, so even if their situations deteriorate further, they will not materially impact the overall performance of the industry or that of professional institutional investors.
Our January article was not written for small companies in dire straits, as such analyses offer them little comfort. Instead, it was intended for a broader audience of potential investors in the biotechnology sector, including generalist venture capital firms and limited partners in specialized investment institutions. These readers may be deterred by other biotech industry analyses that emphasize the number of distressed companies while overlooking their low weightings within the portfolios of professional investors.
The baseline at the time was that, as cash-rich large pharmaceutical companies injected capital into the ecosystem by acquiring promising firms to bolster their pipelines, biotech companies in the development stage were collectively capable of sustaining positive performance.
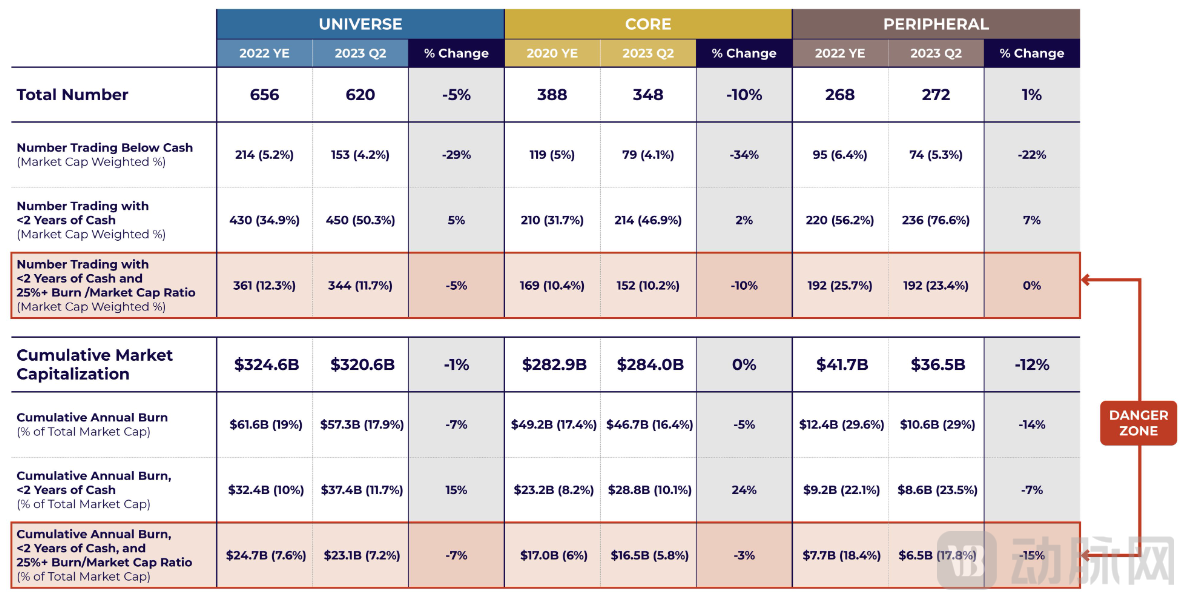
▲Table 1 Big Data Table
The composition and characteristics of our Biotech universe, including its core and peripheral companies, at the beginning and end of the first half of 2023, along with data on the degree of capitalization within these groups. The percentages in parentheses indicate the proportion of the market capitalization of a specific subset of companies relative to the total market capitalization of that group. For example, 79 core companies were trading below their cash value, accounting for 4.1% of the total market capitalization of all core companies.
Six months have passed since the first article was published., we have updated our data (primarily reflected in Table 1), and we clarify here that our argument has been effective and will continue to be so.We also examined the factors driving changes in the number of companies in the core, periphery, and danger zones.As everyone can see, the biotechnology industry is highly dynamic. We believe that the changes observed here are evidence of an industry learning engine, which continuously allocates varying weights and resources to projects with different values and probabilities of success. This engine has been nurtured by safeguarding basic science as its cornerstone and by a market-based incentive framework defined by patents, maintaining its vitality over the past few decades.
The Contraction of the Biotech Universe
At the beginning of 2023, there were 656 publicly traded biotechnology companies in the U.S. that were in the open development stage and had market capitalizations below $10 billion; we refer to this group as the “Biotech Universe.” The aggregate market capitalization of these companies was $325 billion at the start of the year and increased by 14% by June 30 (including acquired companies, as well as Legend Biotech and Apellis, both of which exceeded a $10 billion market cap when they exited the core cohort; any companies that entered the Biotech Universe during this period are excluded).
Although one might assume from this that the biotechnology sector is performing well, we must take into account the impact of financing and reverse mergers; even if a company’s stock price remains unchanged, a reverse merger can increase its valuation.
Due to the small number of newly added companies (we counted five IPOs and five companies that went public via SPAC), and the large number of delisted and acquired companies,In the first half of 2023, the number of companies in the biotech universe decreased to 620, a 5% decline. The total market capitalization of these companies now stands at $321 billion, representing a 1% decrease from the total market value of the biotech universe at the beginning of this year.
The number of companies trading below their cash value decreased by 29%, from 214 (representing 33% of the biotech universe) to 153 (representing 25%). On the surface, this appears to be meaningful progress, until we note that these companies accounted for only 5% of the entire biotech universe in January 2023 and now account for just 4%, indicating that an already small issue has merely shrunk slightly further. Moreover, while some companies are no longer trading below their cash value due to rising stock prices, others have simply burned through cash to the point where it falls below their market capitalization. Therefore, unless we examine each company individually, we cannot truly assess their viability; however, such detailed analysis is not the focus of this article.
As we analyzed last time,Let us return to those companies that are important to professional investment institutions, namely the core biotech companies we consider.
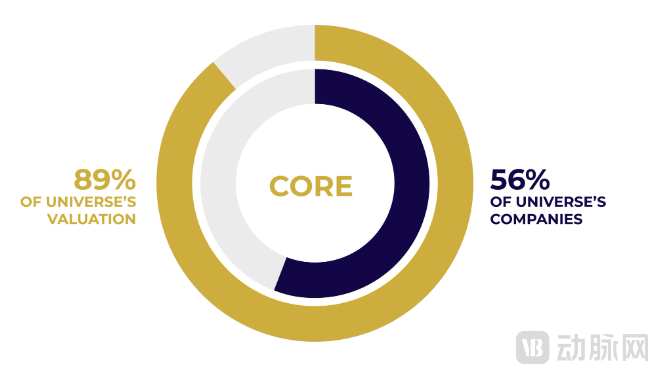
▲ Core biotech companies account for 89% of the total market capitalization of the entire biotech universe, yet represent only 56% of the number of companies.
"Consider how staggering this statistic is,"If nearly half of the biotechnology companies in the development phase (i.e., all peripheral companies) were to fail, relentless headlines would decry the industry’s dire state, and public concern would mount over the catastrophic consequences of drug development failures. However, this would not have a direct impact on the portfolios of specialized investment institutions, and the effect on the most promising drug candidates in the field would likely be minimal.Similarly, if these peripheral companies are acquired at a 100% premium, it will not have a direct impact on professional investment institutions. The indirect impact may be that, in either case, stock trading volume will decline, and pessimism will spread throughout the capital market.
This is particularly relevant to the limited partners (LPs) of professional investment firms, who undoubtedly want to know how industry news affects their investments. The answer is: “It depends, and industry news may not be as important as you think.” This view is not radical; for a long time, investors have been trying to address the issue that indices do not truly reflect the health of an industry or the prospects of any specific investment strategy. We are merely quantifying the degree of divergence between the entire biotech universe and the core biotech companies that truly matter to our industry.
The Core Biotech Company Portfolio
Figure 1 shows that by mid-2023, the number of core biotech companies had decreased by 40 compared to the beginning of the year. Only five newly listed companies joined the core group (two through IPOs and three through SPACs), and 17 peripheral companies moved into the core tier after their shares were purchased by specialized institutional investors. These additions barely offset the reduction in core companies: 15 core companies were acquired, three pairs of companies merged (resulting in a net decrease of three), 16 were delisted, and 26 reverted to peripheral status after their specialized institutional investors divested. Legend Biotech and Apellis saw their market capitalizations exceed $10 billion, thus no longer belonging to the core company set (congratulations to both companies, of course!).
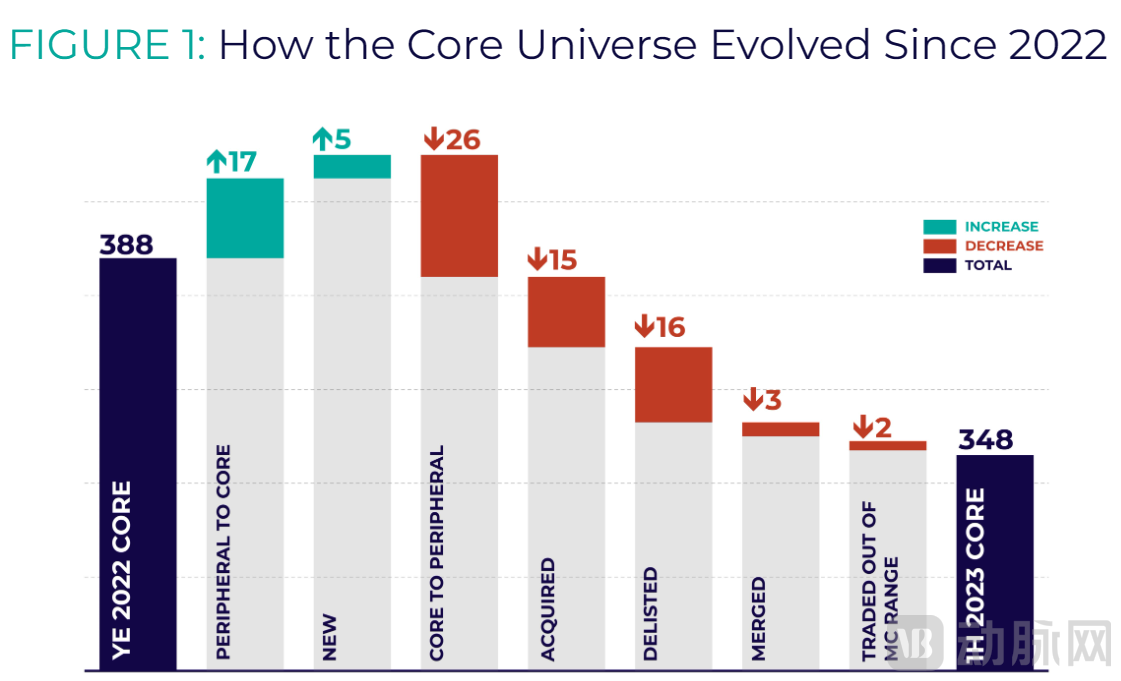
▲Figure 1 Evolution of Core Biotech Companies Since 2022
Dynamic Changes in the Core Company Cohort During the First Half of 2023 (Entry and Exit Scenarios). Please note that “core to periphery” indicates that a company has moved to the periphery because the specialized institutional investors we track have sold all their shares in companies previously classified as core. Conversely, “periphery to core” means that at least one specialized institutional investor on our list has reported holding the stock, thereby reclassifying it as core and removing it from the peripheral cohort. Two companies have “exceeded the MC (market capitalization) range,” meaning they have surpassed the $10 billion upper limit we use to define the “Biotech Universe” (and are therefore classified as neither core nor peripheral).
If we compare the market capitalization growth since the beginning of 2023, the core company cohort (including acquired companies as well as Legend Biotech and Apellis) saw a 15% increase, while the peripheral companies experienced a 10% increase, resulting in a 14% growth for the entire biotech universe. Core companies may have outperformed peripheral ones for various reasons (such as raising more capital on a proportional basis), but this is partly because nearly all profitable acquisitions originated from the core cohort (e.g., Albireo Pharma, Amryt Pharma, Bellus Health, Chinook Therapeutics, CinCor Pharma, CTI BioPharma, DICE Therapeutics, Iveric Bio, Prometheus Biosciences, Provention Bio), whereas peripheral companies had only two very small acquisitions (both private transactions rather than strategic acquisitions).
When examining the shifts of companies between core and peripheral entities, we can observe an interesting phenomenon.
Among the 26 companies transitioning from the core to the periphery, 14 saw their stock prices drop by more than 20%, mostly due to negative clinical data. However, seven companies experienced stock price increases of over 20% in the first half of the year. Two core companies saw their stock prices surge by 100% driven by favorable clinical data... Yet these companies have lost their institutional professional investors. This is perfectly fine! The withdrawal of institutional professional investors may not necessarily indicate a decline in value; it could even be a sign of success. Meanwhile, 17 peripheral companies gained at least one institutional professional investor as a shareholder, thereby entering the core group. Among them, four companies saw their stock prices rise by more than 20%, while eight experienced declines exceeding 20%.
You may have heard people claim that a stock’s price dropped because someone was selling. We have been working to dispel this misconception, as every share sold is simultaneously being bought.We have evidence showing that stock price increases or decreases may lead to gains or losses of professional institutional investors; there is a correlation between them, but not a causal relationship.
Buying or selling is not the cause of stock price movements. Many stocks may trade at a single price for extended periods. Changes in stock prices reflect shifts in investors’ perceptions of a company’s value; however, it should be noted that this reflects only the views of those investors who are actively assessing the company’s value. Stock trading serves as the mechanism through which these changes in value perception are transmitted to the rest of the world.
Before considering private companies, this may seem confusing, or at least a trivial abstract concept. In the case of private companies, their value also fluctuates in the minds of investors. However, as long as there is no stock trading, it is difficult for everyone to see changes in the company's value. This is why, in the absence of a “daily market” to inform private company investors how to assess their value, these companies should attempt appropriate price discovery while they still have cash to adjust their direction. One strategy is to fully leverage investors on their board of directors, as some experienced biotech board members and executives have discussed in our Gateway learning modules.
Peripheral Companies Are Like “Farm Teams”
Although the market capitalization of peripheral biotech companies rose by 10% in the first half of 2023, and four companies joined the ranks of peripheral firms (a 1% increase), the total market capitalization of peripheral companies ultimately declined by 12% by the end of the first half. This may seem counterintuitive, but we believe it reflects a very reasonable dynamic between core and peripheral companies.
Figure 2 shows that 17 peripheral companies transitioned to core companies in the first half of 2023. Their average market capitalization was $1 billion (median: $200 million). In contrast, the 26 companies that shifted from core to peripheral had an average market capitalization of slightly over $300 million (median: nearly $100 million).In other words, experts take over more valuable peripheral companies, hoping that their market capitalization will further appreciate, while selling off core companies with lower market capitalization, usually after they have suffered significant setbacks, thereby transferring them to the peripheral category.Thus, these data tell a plausible story. Of course, when such phenomena occur, we always maintain a degree of skepticism; therefore, we will continue to monitor these developments in the future to see whether they remain consistent with rational expectations.
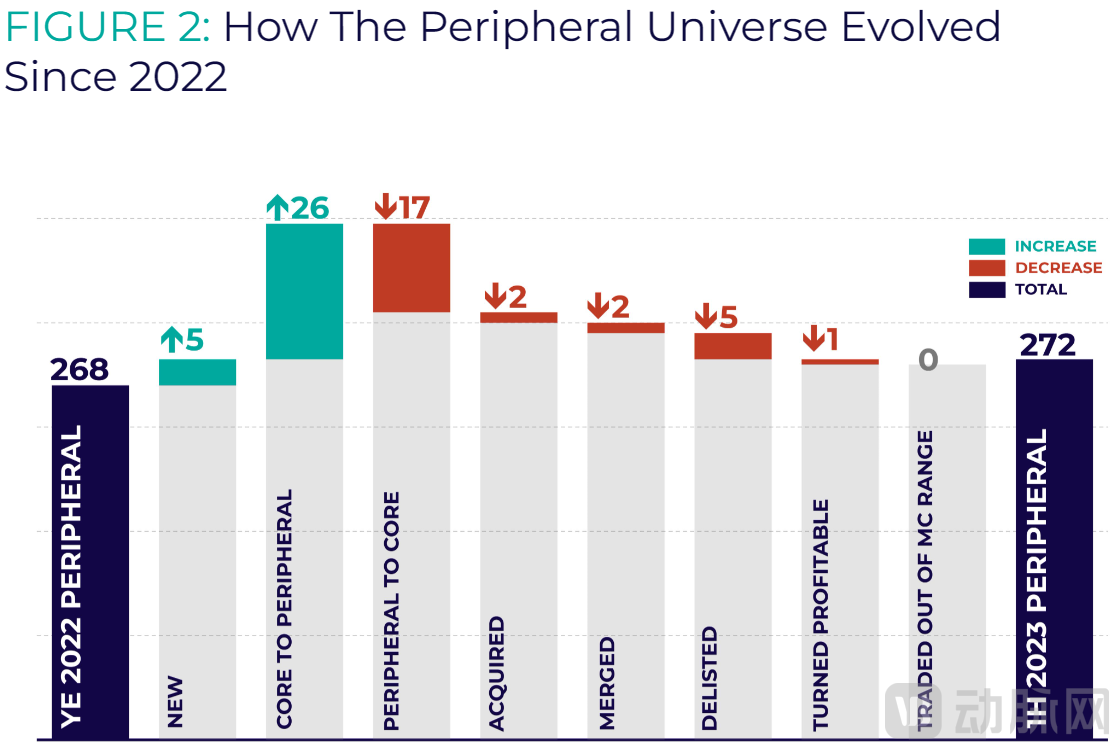
▲Figure 2 Evolution of Peripheral Companies Since 2022
Peripheral Company Dynamics (Entry and Exit Scenarios) in the First Half of 2023. “Core to Peripheral” signifies that a company has been reclassified as peripheral because the professional institutional investors we track have sold all their shares in companies previously designated as core. Conversely, “Peripheral to Core” indicates that at least one professional institutional investor on our list is shown to hold the stock, thereby reclassifying it as core and removing it from the peripheral group.
M&A: A Powerful Potential Return Driver at Current Market Valuations
Throughout the biopharmaceutical ecosystem, mergers and acquisitions (M&A) are a natural part of the industry lifecycle. Few sectors see M&A activity as prevalent or anticipated as the biotechnology industry. For years, large pharmaceutical companies have recognized their symbiotic relationship with smaller biotech firms and have been open about their intent to acquire these companies to secure the most promising product pipelines.
Although it is well known that the strategic divisions of large pharmaceutical companies hold substantial cash reserves, we prefer to gauge their collective M&A strength by their free cash flow. Figure 3 shows,The strategy department needs only 2.7 years of free cash flow to acquire all core biotech companies at a 100% premium. The market capitalization of the target companies is so minuscule compared to the cash reserves of the M&A giants.
By this standard, the biotech universe in its development phase is now cheaper than in the past, particularly for its core companies, whose market capitalizations are far below the 2020 peak and only slightly above the mid-2016 trough, a period marked by the previous major biotechnology downturn. If the market capitalizations of biotechnology companies fail to rise and no new entrants join the cohort of core companies, acquisition rates will decline further as large pharmaceutical companies’ strategic departments see growth in free cash flow over the coming years, making acquisitions increasingly attractive.
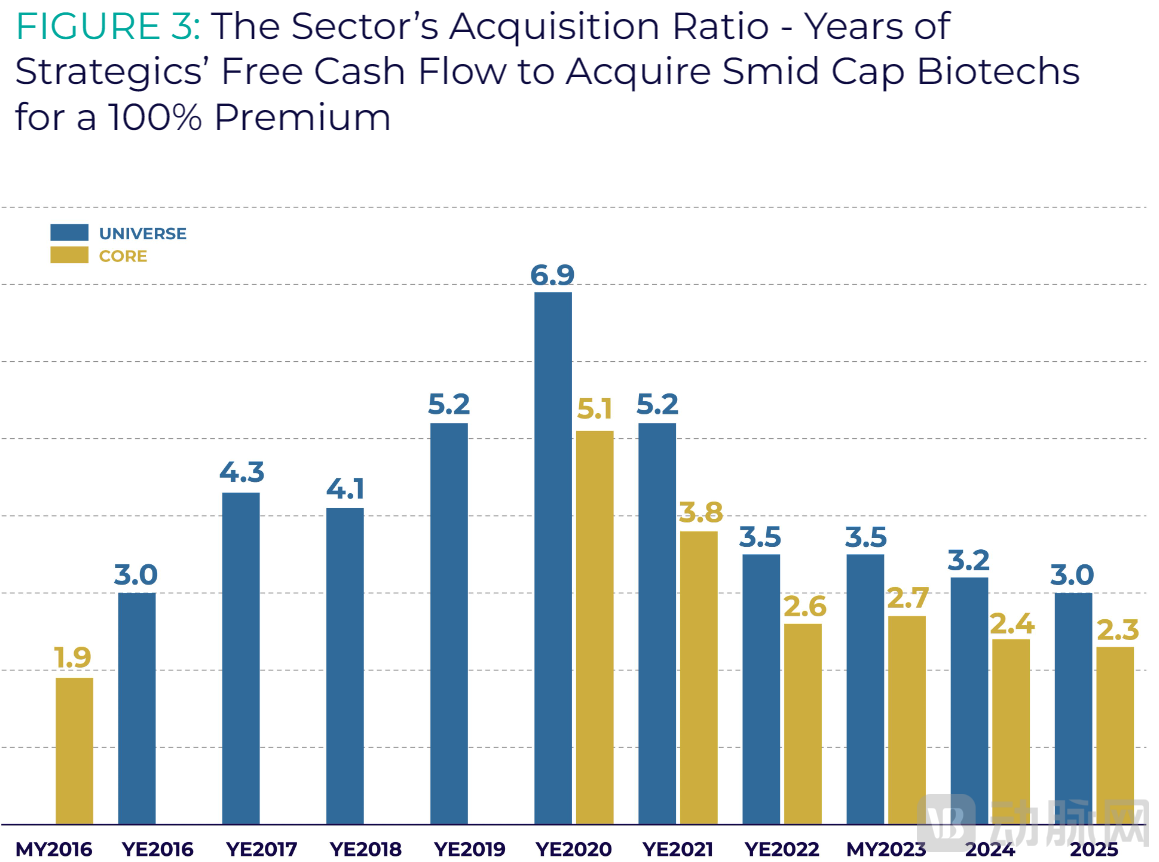
▲Figure 3 Industry Acquisition Ratio—Years Required for Large Pharmaceutical Companies’ Strategic Divisions to Acquire Small Biotechnology Companies at a 100% Premium Using Free Cash Flow
Based on the value of free cash flow from the strategic division over several years, the M&A conditions are favorable. The acquisition would involve either acquiring the entire biotech universe at a 100% premium or only acquiring the core portfolio, which we refer to as the industry’s acquisition rate. We did not calculate the value of core companies for 2016 or 2017–2019, as doing so would be tedious, and the existing data is sufficient to reveal clear trends in the biotech universe. The MY2023 figures correspond to the latest data available through the first half of 2023. The 2024–2025 figures are derived from sell-side forecasts of biopharmaceutical free cash flow, indicating what the acquisition rate would be in the coming years if current valuations remain unchanged.
As can be seen from Figure 4,2023 is poised to be one of the years with the highest number of transactions on record, which is indeed encouraging, yet hardly surprising.. The number of transactions, the total market value of acquired companies in the development stage, and the transaction premiums paid (in USD) for this year are likewise unsurprising. Note that because we focus on biotech companies with a market capitalization below $10 billion, our data are not skewed by large-scale acquisitions such as those of Celgene and Seagen.
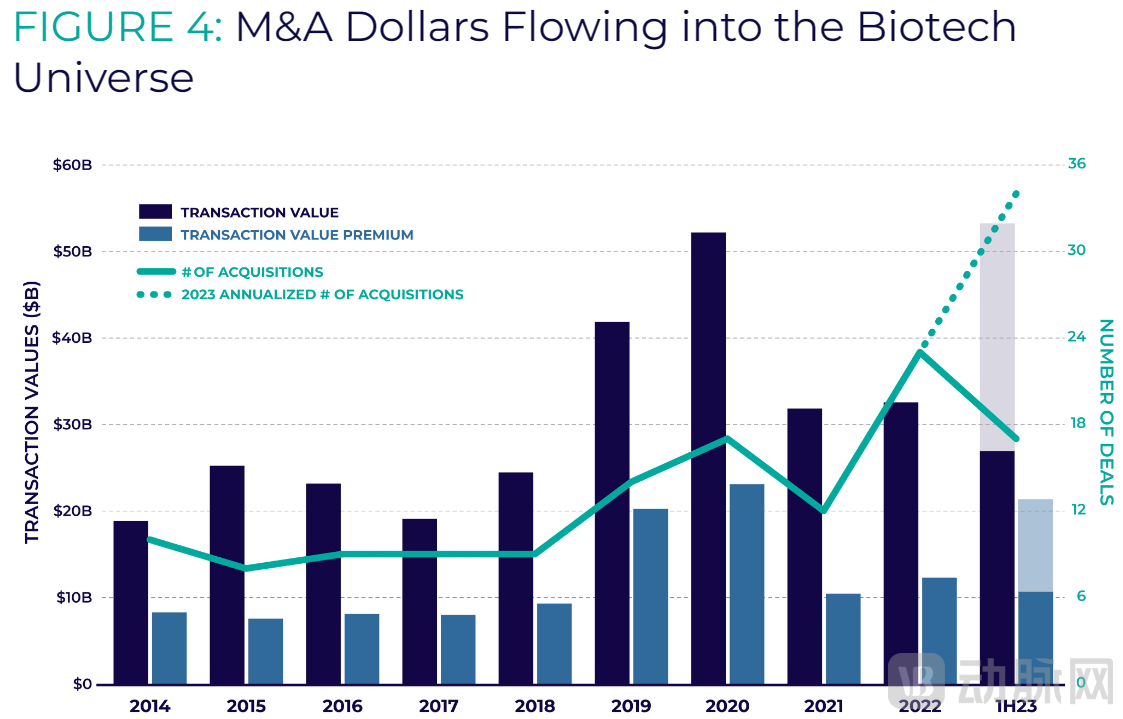
▲Figure 4 M&A Capital Flowing into the Biotech Universe
M&A transactions in 2023 surpassed those in 2022 in both total value and number of deals, likely because acquisition costs in the industry remained relatively low. The faded extension bars for the first half of 2023 represent a simple doubling, illustrating the projected full-year value if the M&A activity observed in the first half of 2023 were to continue at the same pace for the remainder of the year.
We believe this pace of M&A is reasonable and sustainable, as the industry environment thereafter remains similar to that in the first half of 2023.Moreover, these mergers and acquisitions reflect a fundamental fact: large biopharmaceutical companies are substantial in size and well-capitalized, and they consistently need to replace revenues eroded by generic competition (and ultimately, Medicare price negotiations). This is a feature, not a bug, of the social contract within the biotechnology sector. While small companies serve as a prolific source of innovation, their numbers remain limited compared to the growing demand from the strategic divisions of larger corporations.
Notably, the shorter light-blue bars in Figure 4 represent the total dollar value of M&A premiums, which is what makes mergers and acquisitions attractive. Premiums typically range from 50% to 100% above the final transaction price (we estimate the average M&A premium to be approximately 70%).
In the first half of 2023, total M&A premiums amounted to approximately $11 billion, representing a 3.4% return relative to the biotech sector’s total market capitalization of $325 billion at the beginning of 2023. Of this $11 billion in premiums, 98% flowed to core companies (close to the historical average of 99.5%; see Table 2), equivalent to a 3.8% return on the $283 billion market capitalization of core companies at the start of 2023. This constitutes a fairly strong source of alpha (excess return) for just a six-month period.
It would be a pity if misguided Federal Trade Commission (FTC) policies made such mergers and acquisitions more difficult. This could dampen investor interest in biotechnology, don’t you think? Yet, this is precisely what the current administration has proposed. Therefore, anyone hoping to see capital flow into the biotechnology sector would want the government to issue sound policies on how to regulate mergers and acquisitions.
More Core Companies?
Currently, we maintain that the presence of a single professional investment institution as a shareholder suffices to classify a company as a core biotech firm. What, then, of companies backed by two, three, or more such professional investors?
For example, our January analysis revealed that although 86% of M&A transactions occurred within the core company cohort, 98% of M&A capital flowed into acquisitions of these core companies (accounting for 99.5% of M&A premiums). Despite the core cohort comprising only 59% of the entire biotech universe, investment by specialized institutional investors appears to signal a higher likelihood of acquisition.
Table 2 shows that if we focus on companies backed by at least two or three professional institutional investors (“2+ Core” and “3+ Core” companies), the $11 billion share of M&A premiums (theoretically assuming M&A activity in the second half of 2023 matches that of the first half) becomes slightly more concentrated among companies with “more core” investors, rising from 3.9% for “1+ Core” companies to 4.2% for “3+ Core” companies. This may merely be speculative, but what makes this hypothesis more compelling is the observation that companies backed by only one or two professional institutional investors (“1–2 Core” companies) captured only 2.3% of M&A premium returns. We will look to future M&A data to determine whether core companies backed by a greater number of professional institutional investors can consistently secure a larger share of M&A returns. For now, this remains purely hypothetical.
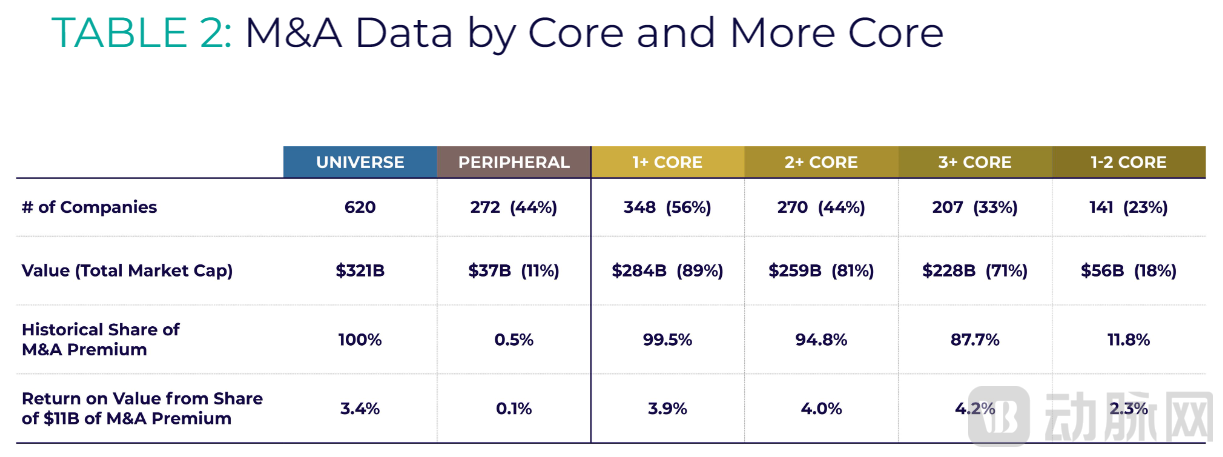
▲Table 2 M&A Data by Core and Expanded Core Segments
Will M&A premium capital disproportionately accumulate in companies with more core assets? Perhaps so. Please note that the data in this table are global figures as of June 30, 2023. The percentages in parentheses should be understood as their share of the global total. Thus, the 207 companies with 3+ core assets represent 33% of the 620 companies worldwide. We use an M&A premium of $11 billion in the last row, reflecting the actual figure for the first half of 2023, and employ it as a reasonable estimate for what might occur in the second half of 2023 to illustrate returns across each market segment. Therefore, to calculate the 4.2% for the lowest unit among the 3+ core category, we multiply 88% by $11 billion and then divide by $228 billion.
But let us imagine that this effect is real. Should investors only invest in biotech companies backed by three or more professional institutional investors? Perhaps a retail investor could manage their portfolio this way, and even a small fund might do so. In reality, however, any large fund must build substantial positions over time, often through financing rounds, to accumulate meaningful equity stakes in companies—a strategy that other professional institutional investors may or may not appreciate. At the time of initial investment, the target company may be a peripheral player (or even a private company). Furthermore, mergers and acquisitions are not the sole source of returns in the biotechnology sector. Stock prices can also rise as investors gain greater appreciation for a company’s value (perhaps because many investors wish to hold shares before a potential acquisition occurs).
At the same time, some of us hope that we may enter a new era in which we learn to build more companies like Vertex Pharmaceuticals and Regeneron—companies that were excluded from the core company set years ago (due to their market capitalization exceeding $10 billion or their achievement of profitability) and have now become part of the acquisition tier.
What about private companies?
In this analysis, the fate of private companies is effectively represented by only a few metrics that we have not discussed in depth: private enterprises transitioning to public status through IPOs, SPACs, and reverse mergers. Due to delistings, acquisitions, and even the consolidation of two public biotech companies into one (a scenario that occurred five times, merging 10 public biotech companies into five), the rate at which companies enter the biotech universe cannot match the rate at which they exit.
The biotech universe abhors a vacuum. It will absorb companies from the private sector. Of course, not all of these companies will win the favor of professional investment institutions. In the first half of 2023, there were five IPOs in total, only two of which entered the core biotech group.Although the pace of IPOs is currently slow, it can easily accelerate as long as private company management teams, shareholders, and public market investors are aligned on valuation.Perhaps this alignment will stem from private companies’ desire to go public, diminishing concerns about public markets, or from the intersection of both.
In any case, we will ultimately see a better balance, with companies operating more smoothly on the funding conveyor belt. However, there is insufficient private capital to fund all the compelling projects we observe in the primary market. Public investors will eventually realize that the existing public biotech universe cannot absorb the capital they wish to allocate to the biotechnology sector.As has often been the case in the past, investing in new projects in the primary market will become meaningful.
We do not believe that SPACs are a reliable path in nearly all cases; however, in rare instances, reverse mergers can make sense for both parties at the appropriate time, thereby serving as a viable cross-border alternative.Therefore, we believe that an IPO is a metric worth monitoring.
Strategic departments have the capacity to seize first-mover advantages in public markets and acquire desired assets from private biotech companies. However, this typically requires them to assume greater risks and development costs—thereby impacting their profit and loss statements—than they are comfortable with, which undermines the very rationale for outsourcing R&D to the small biotechnology ecosystem in the first place. Therefore, we do not believe that investors will ultimately cede the cultivation of the biomedical R&D ecosystem to large pharmaceutical companies.Soon, investors will assume greater responsibility, exercising more caution than in 2020 but with more confidence than in 2022.
It is worth noting that, due to the 45-day delay in the release of Form 13F data, our analysis of stock performance in the first half of 2023 referenced Form 13F filings from mid-February (reflecting changes in Q4 2022) and mid-May (reflecting changes in Q1 2023). This may seem insignificant, but consider a peripheral company that, at the end of 2022, appeared to have no institutional investors among its shareholders based on the latest available 13F filings (which only reflected data up to Q3 2022). However, in mid-February, we discovered that the company had already secured investment from several institutional investors when it completed its financing round in November 2022. Clearly, this financing event marked the company’s transition into the core cohort; in hindsight, it should have been classified as a core company since 2022. Nevertheless, we could not have known this until mid-February, leading to its misclassification as a peripheral company at the beginning of the year. This is an unavoidable limitation of our analysis, though we believe it is minor. This is also one of the reasons why we do not mention specific operating company names in this report. We only refer to companies that have permanently exited the market through acquisitions, delistings, or other transactions, or we mention companies without specifying whether they are classified as core or peripheral. When classifying new companies listed in Q2 2023 as either core or peripheral, we did not have access to Form 13F data (as shareholding data as of June 30 will not be disclosed until mid-August). Instead, we reviewed Forms 13D/G and past financing press releases to determine whether any institutional investors had decided to invest in companies on our core list. If no such investment was identified, the IPO was assigned to the peripheral group. While this approach may introduce some classification errors, their impact on our overall analysis is minimal.
*Original link: Semper Maior: RA Capital's 1H23 Core Biotech Report
https://rapport.bio/all-stories/semper-maior-1h23-core-biotech-report