mRNA Vaccine(such as Pfizer-BioNTech's BNT162b2 and Moderna's mRNA-1273)Highly effective against the SARS-CoV-2 spike protein for COVID-19. These vaccines trigger both humoral and cellular immune responses, with cellular immunity potentially offering greater protection against SARS-CoV-2 variants. Additionally, studies show that the number of reactive T cells in peripheral blood increases after receiving SARS-CoV-2 mRNA vaccines, particularly after the second and third doses.The SARS-CoV-2 spike protein contains multiple regions recognized by CD4+ and CD8+ T cells.The intensity and kinetics of T-cell responses vary across different regions.The same region can be recognized by multiple T cells.These T cells share the same T cell receptor sequence and antigen specificity.Since the T-cell response triggered by mRNA vaccines involves multiple clones, a comprehensive analysis of the T-cell response is required to more accurately understand the cellular immune response elicited by mRNA vaccines. However, the clonal response of T cells to mRNA vaccines has not yet been analyzed in detail.On March 7, 2024, researchers from the University of Tokyo《Cell Reports" Published an article titled "CD8+ T cell memory induced by successive SARS-CoV-2 mRNA vaccinations is characterized by shifts in clonal dominance The research article conducted TCR sequencing on approximately 40 patients, and the results revealed,After each vaccination with the Pfizer mRNA vaccine, there is a significant change in the number of T cells, andCertain spike epitopes can become immunodominant,Epitope-specific changes in vaccine-reactive immune cell clonotypes were also discovered.。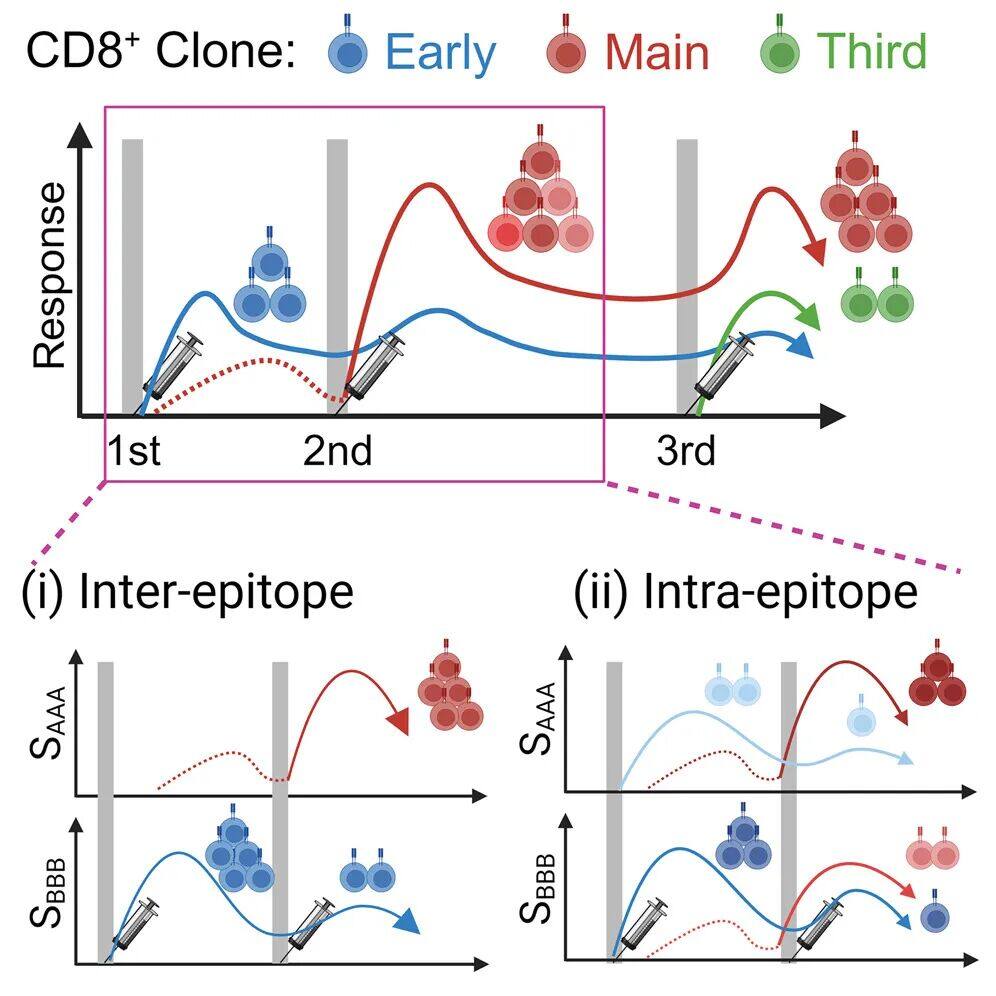
" New Clones Dominate T-Cell Response After Second Vaccine Dose "
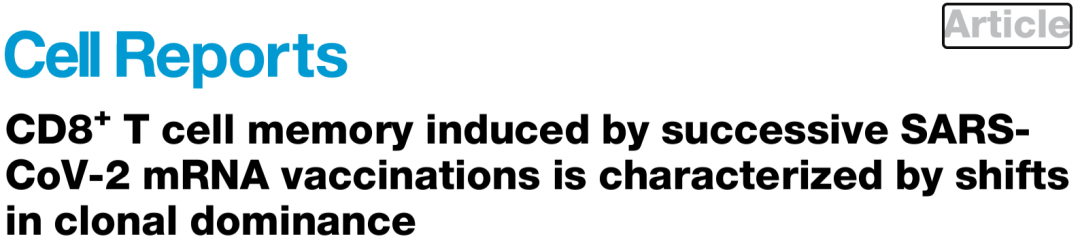
The research team studied 38 healthcare workers who received three doses of the Pfizer BNT162b2 vaccine.Collected at 10 time pointsThese participants' PBMC samples. In addition, samples were collected from 26 participants two weeks after seasonal influenza vaccination.(P7)。TCR sequencing analysis was then performed on the isolated CD4+ and CD8+ T cells from these samples. To analyze the kinetics of T cell clonal responses to mRNA vaccination, they also compared the frequencies of clonotypes between time points and identified significantly expanded clonotypes after each vaccination.(Figure 1B)。Figure 1 Identification of clonotypes reactive to vaccinationThe results showed,T cell response peaks 10-18 days after the first dose of mRNA vaccine。After the second injection, the T-cell response reaches its peak in approximately 7 days..After the second injection, the total frequency and diversity of CD4+ and CD8+ T cell clonotypes also peak.(P3, Figure 1C,D)。In addition,Clonal expansion was also observed in the early stages after the first injection.(P2). It should be noted that,For CD4+ T cells,Compared with the main responder clones produced by the classical prime-boost reaction, the early responder clones exhibited faster kinetics.(P8)。Based on these results,The CD8+ T cell clonotypes responding to the vaccine were subsequently classified.(Figure 1E), includingEarly Responders(P2),Main Reactor(P3) AndThird Responder (P8)By calculating the total frequency at each time point, the range of early, primary, and tertiary responder clonotypes for each subject was summarized. The total frequency of each response pattern was also tracked longitudinally.(Figure 1F)。After the second injection, the total frequency of primary responders exceeded that of early responders, indicating a clonal dominance shift from early responders to primary responders.After the third injection, although amplification of the third responder was observed, the primary responder still dominated.(Figure 1G). Notably,After the third injection, the primary responders expanded approximately 16-fold, while the early responders expanded only about 2-fold.(Figure 1H)。
These results indicate that,T Cell Clonotypes Responding to mRNA Vaccination Transition from Early Responders to Predominant RespondersA similar clonal shift in response was observed in CD4+ T cells." After the second and third vaccine doses, the dominant responder clonotypes exhibited an effector memory phenotype. "
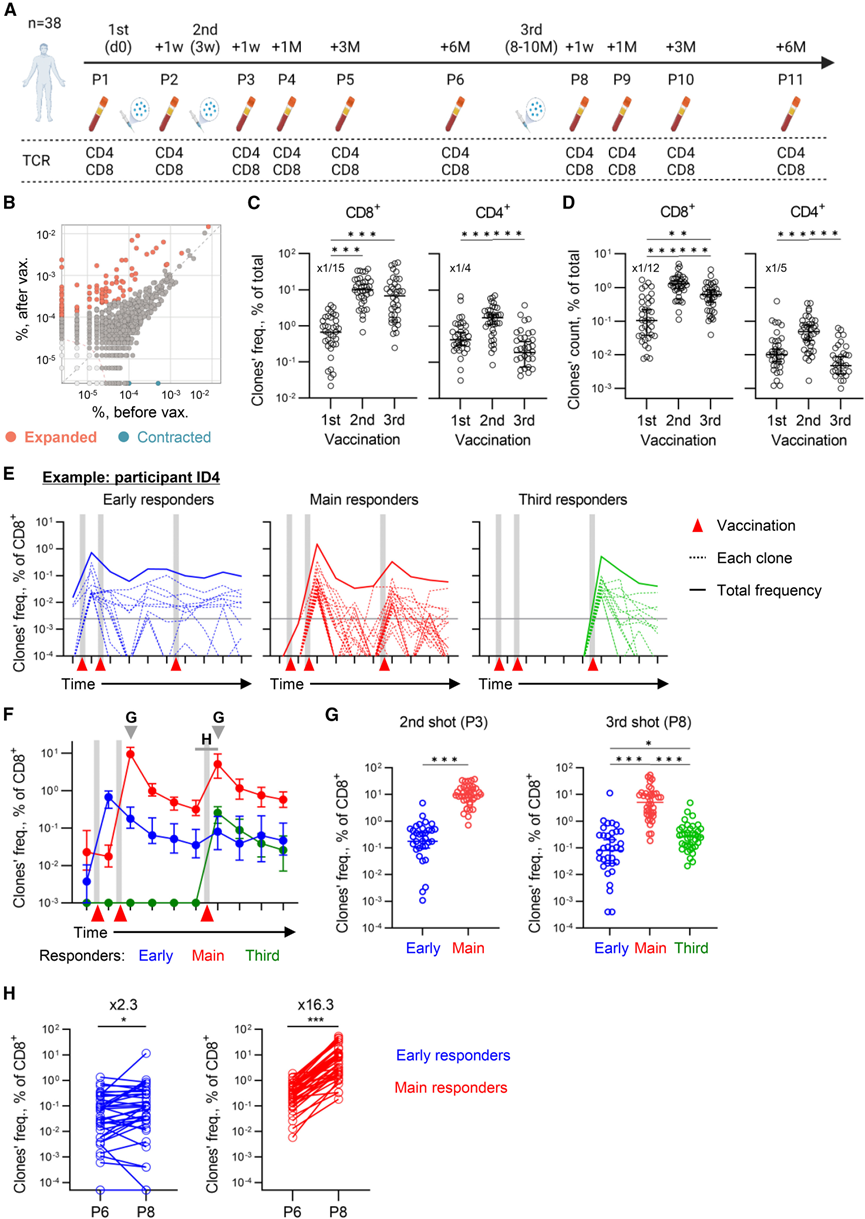
The second and third were analyzed next.Phenotypes of Primary Responders After Vaccination.sc-RNA sequencing was used,scTCR SequencingAnd protein expression(AbSeq)The analytical method studied CD8+ T cells from 7 participants, dividing conventional non-naive CD8+ T cells into six clusters and characterizing these clusters.(Fig. 2A, B)。The results showed that,Cluster 3 cells express characteristics of stem cell-like and central memory T cells, while cluster 2 cells express characteristics of effector memory T cells.,The remaining four clusters exhibited effector functions, matching the expression of CD45RA on effector memory T cells.。Clusters 0 and 1 are mainly composed of oligoclonal T cells, while cluster 3 is primarily composed of polyclonal T cells.(Figure 2C, D), This clonal trend persisted after the second and third vaccinations.Figure 2 Single-cell analysis of non-naive CD8+ T cells after vaccinationAnalysis shows that between the second and third vaccine doses, primary responders T were identified.EMChanges in Cell Gene Expression Profiles(Figure 2G)After the third vaccination, the expression of some genes related to the cell cycle, memory formation, and costimulatory receptors significantly decreased. In addition, T EMCells in TTEScores for sample and effector function were higher after the third vaccination.(Figure 2H). Therefore,Main responders tended towards T after the third vaccination.EMRACell-like Phenotype。" Clonotypes of Primary Responders Change After the Third Vaccination "
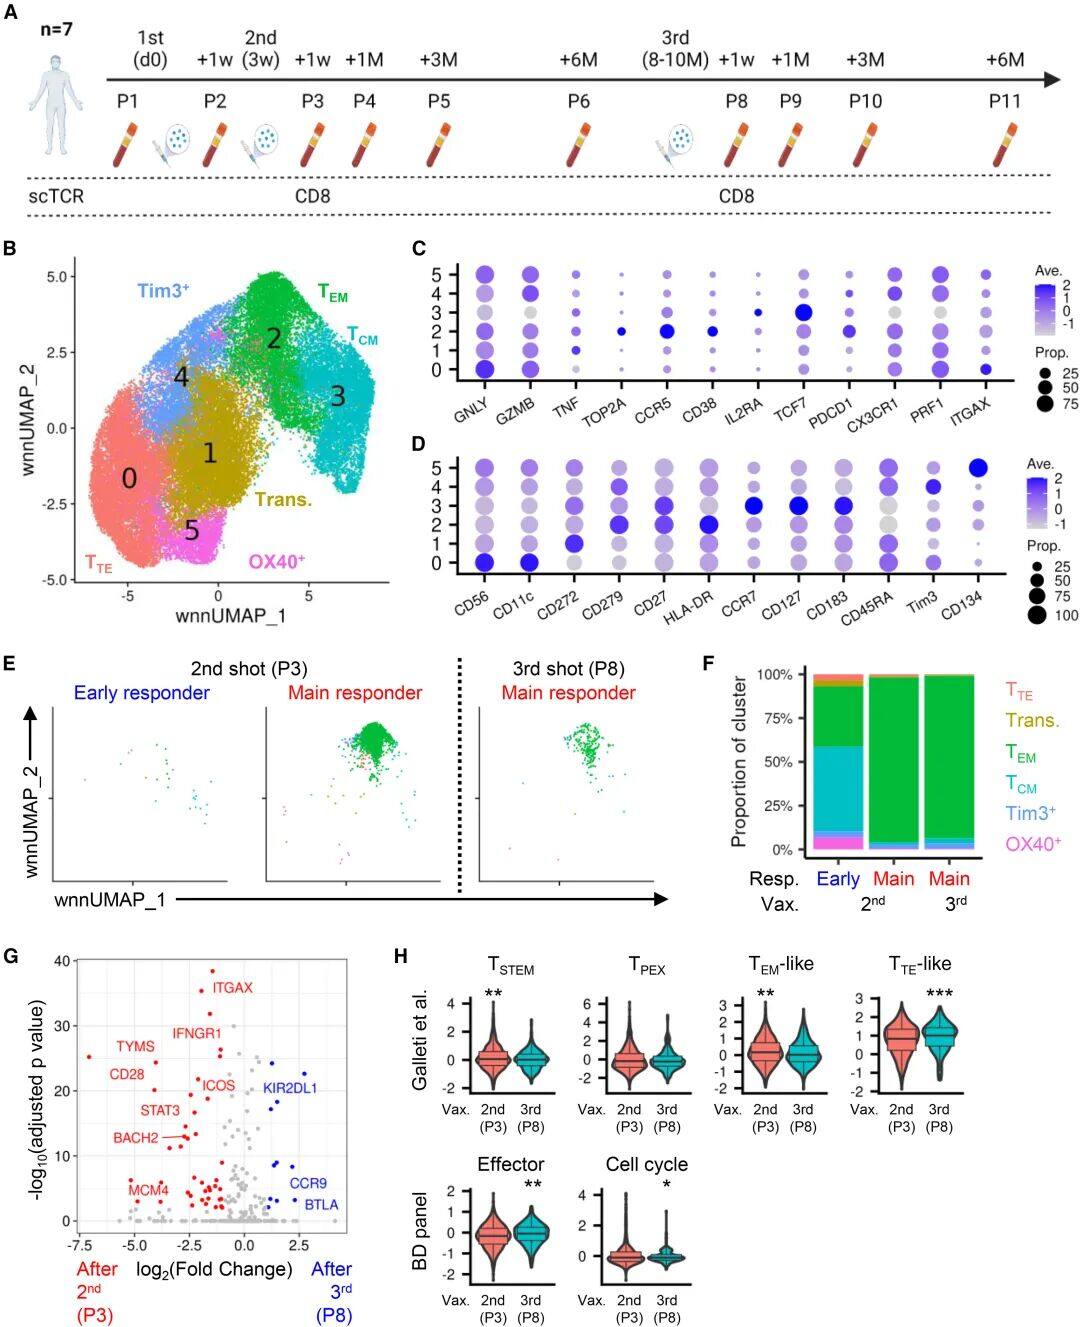
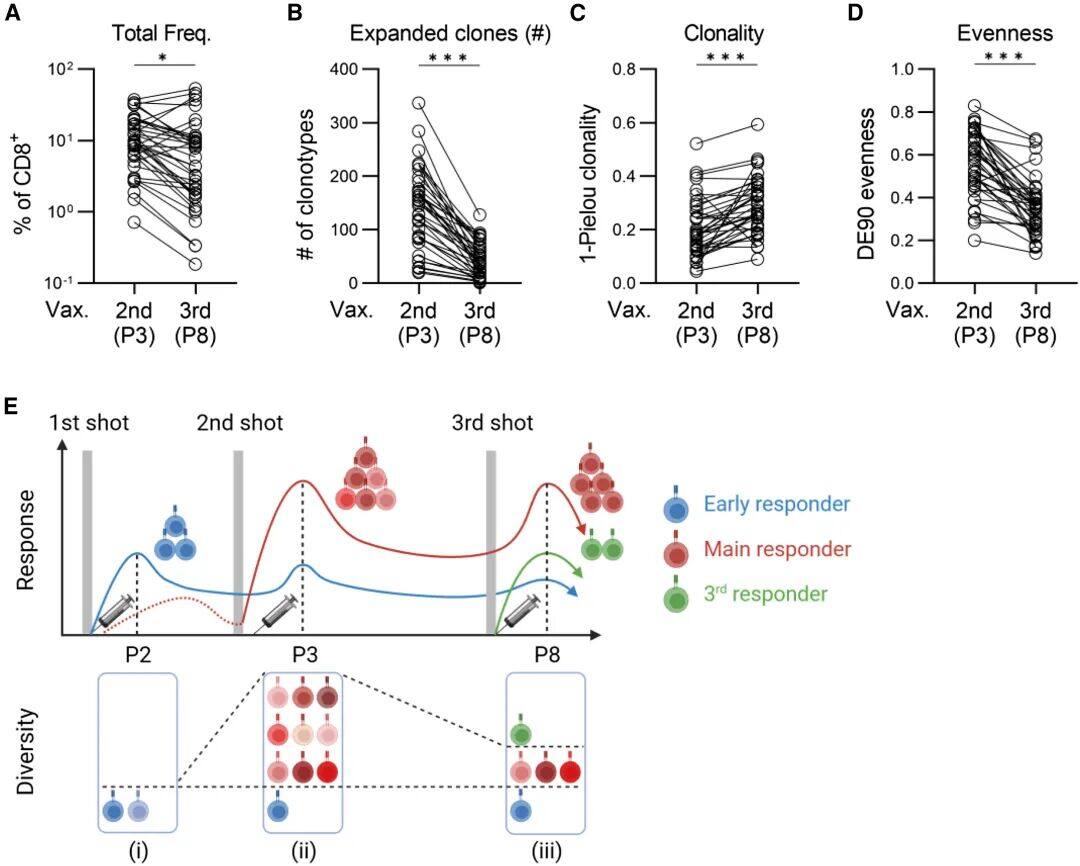
Further analysis was conducted on the changes in primary responders after the second and third vaccine doses. After the third dose,The total frequency and fold amplification of the main responders significantly decreased.(Figure 3A)。It is worth noting that,Main Reactors After the Third Injection("Main Respondent of Memory Source")The total number of clonotypes amplified in China is significantly lower than the total number of major responders.(Figure 3B),The main responders accounting for the source of memory only make up about 30% of the total main responders.。At the same time, the clonotype distribution of primary responders changed after the third vaccination, with increased clonality and uneven distribution.(Figure 3C, D)In addition, the appearance of the third responder partially compensates for the decline in the diversity of primary responders. These changes are also observed in CD4+ T cells.Figure 3Re-expansion of CD8+ Major Clonotypes After the Third InjectionBased on these results, theySimulated the response of CD8+ T cell clonotypes after mRNA vaccination(Figure 3E)First, the early responder clones rapidly expanded after the first injection. Then, the primary responders significantly amplified after the second injection and became the dominant clonotypes in the repertoire. After the third injection, a subset of the primary responders expanded again, but to a lesser degree, leading to a reduction in the repertoire breadth. Meanwhile, the emergence of tertiary responders partially compensated for the decline in diversity among the primary responders." CD4+and CD8+ Clonal responses of T cells to mRNA vaccination are partially coordinated "
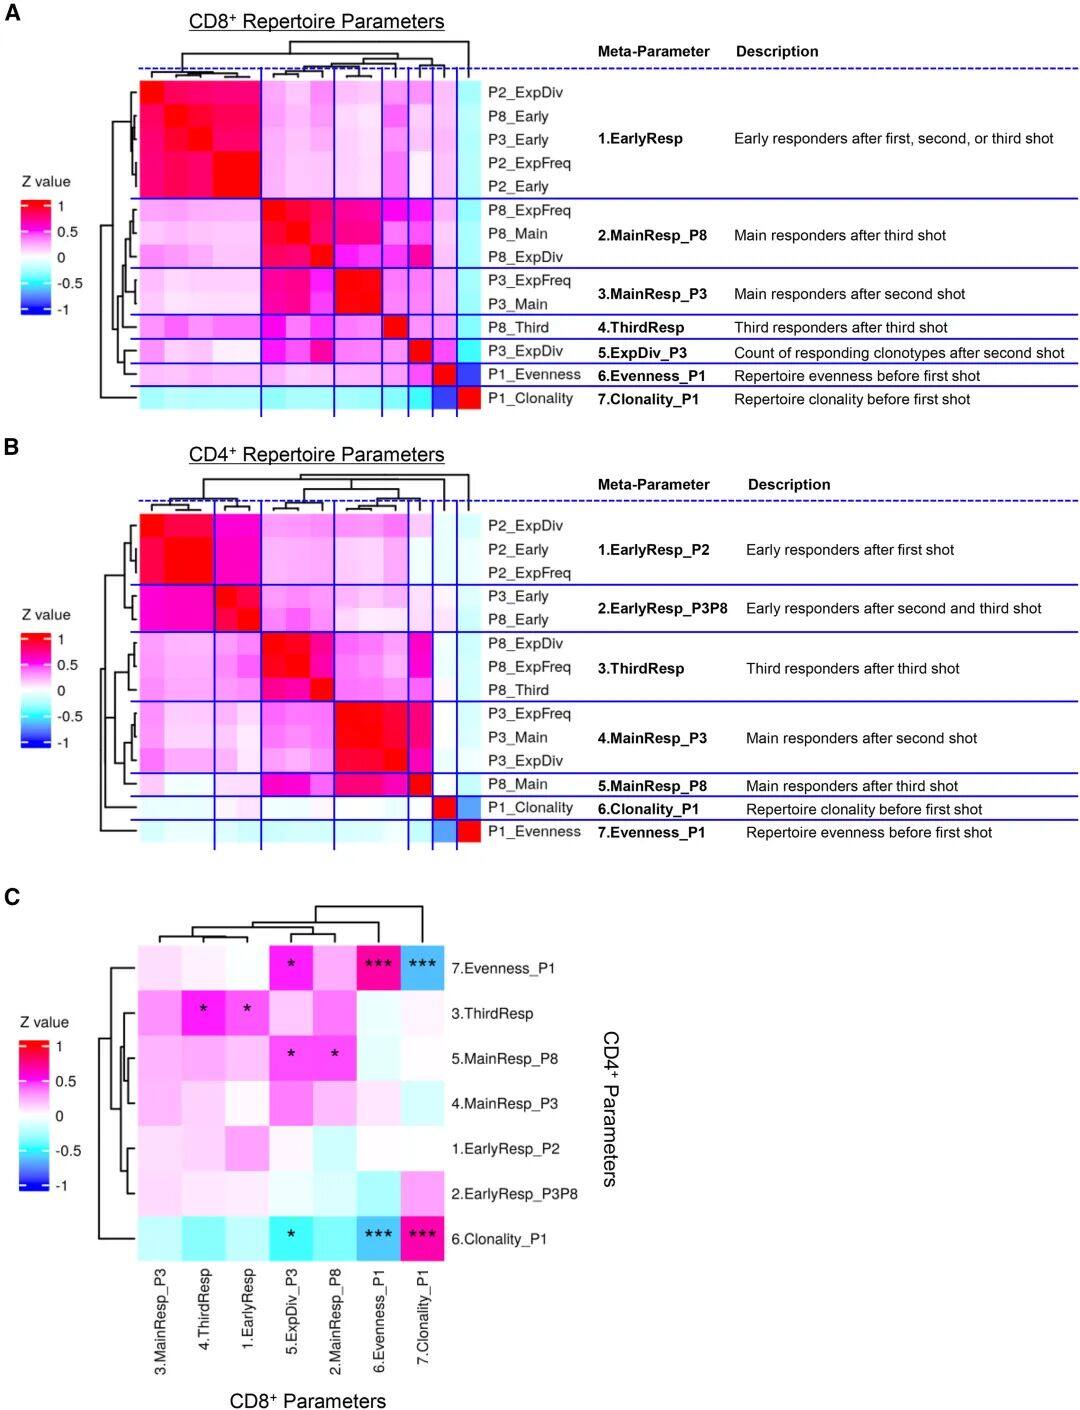
Next, they analyzed the relationship between the meta-parameters of the CD8+ and CD4+ T cell pools and found a positive correlation between them. For instance, there is a positive correlation between parameters such as CD8+ and CD4+ ThirdResp, and CD8+ and CD4+ MainResp_P8.(Figure 4C). This indicates that,Partial Coordination Exists Between CD4+ and CD8+ T Cells in the Clonal Response of mRNA Vaccines。Figure 4 Correlation analysis of CD4+ and CD8+ T cell repertoire parametersThe relationship between the T-cell repertoire and other variables, including participant background, antibody titers, and the intensity of adverse events, was then analyzed. The results showed that the CD8+ repertoire meta-parameter was positively correlated with antibody titers, and early responders were also positively correlated with the severity of adverse events.In addition, all meta-parameters of CD4+ T cells were positively correlated with the severity of adverse events. No significant associations were found with gender or specific HLA genotypes, but some associations showed larger effects. For example, there was a significant association between CD8+ MainResp_P3 and HLA-B*52:01 or between CD4+ MainResp_P3 and HLA-DRB1*15:02. These results suggest that increasing the number of donors may make the associations between the T-cell repertoire and HLA alleles more apparent." Temporal Dynamics Analysis of T-Cell Clonotypes Within Spike Epitopes "
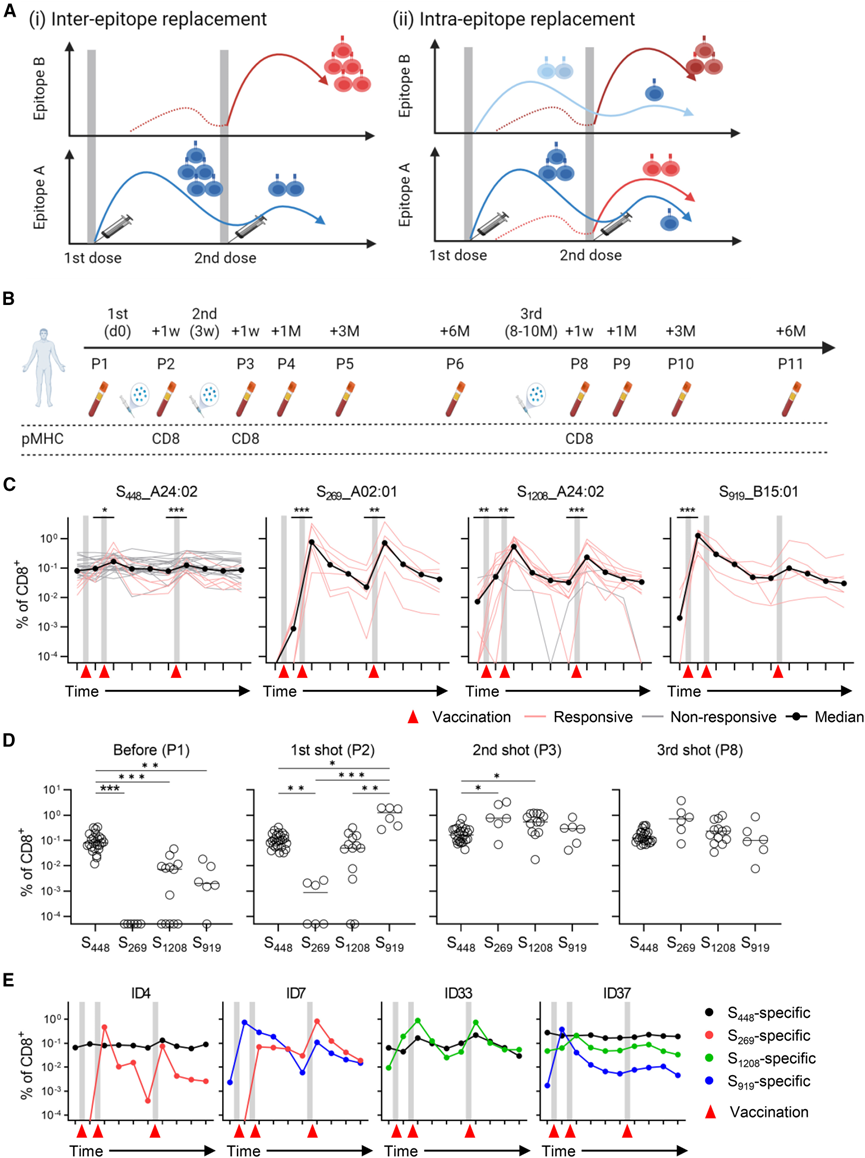
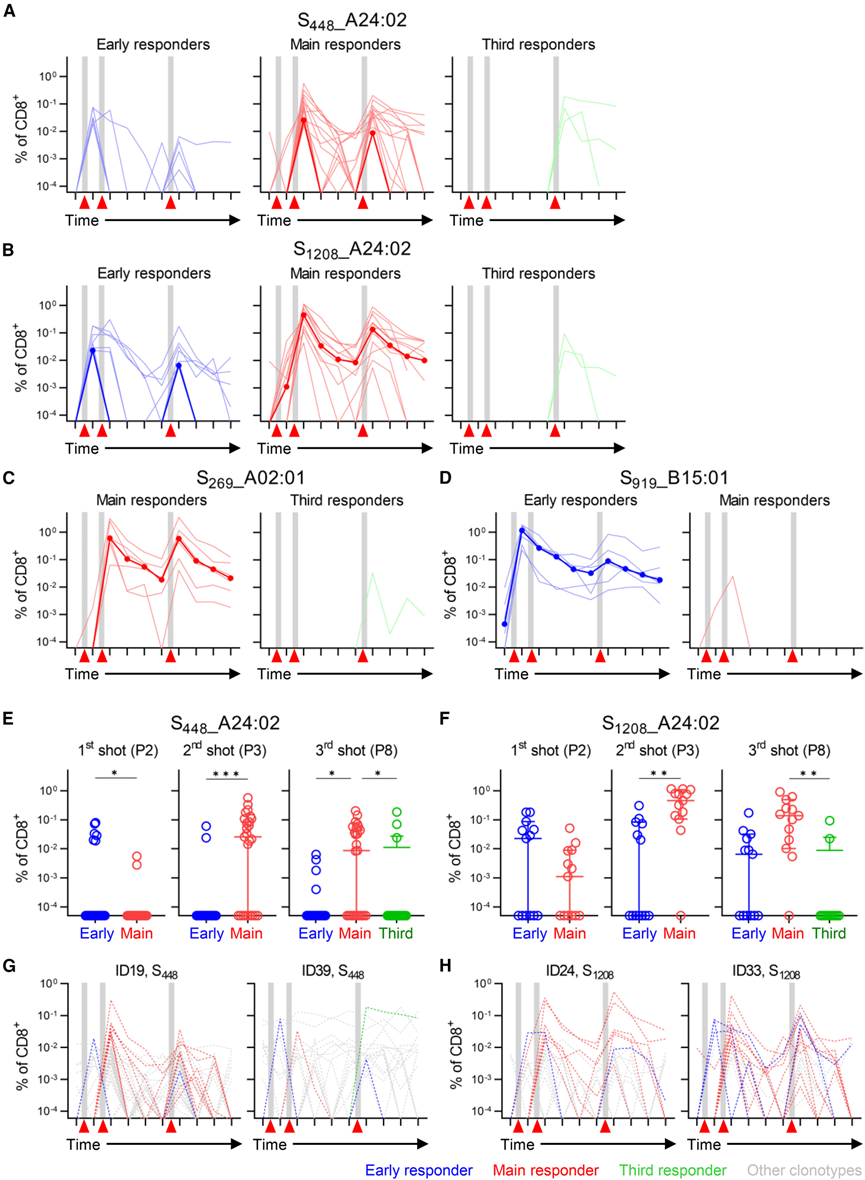
These results suggest a shift in dominance among vaccine-reactive clonotypes during mRNA vaccination: from early responders that expand rapidly after the first injection to primary responders that expand dramatically after the second injection. However,It remains unclear how this shift in clonal dominance occurs.(Figure 5A)。There are two possible explanations: inter-epitope shift and intra-epitope shift. To determine the model of clonal dominance transition, the dynamics of T cell clonotypes for individual epitopes were subsequently analyzed.Figure 5 Analysis of spike-specific clonotypes using pHLA-tetramer stainingTo study the clonal shift of vaccine, four known immunodominant SARS-CoV-2 spike epitopes were selected, respectively.S269, S448, S1208, and S919.Tetramers were prepared and flow cytometry was used to detect the presence of CD8+ T cells specific to these four epitopes.(Figure 5B)。The results showed,After the first injection, the positive rate of S448- and S919-specific cells increased, while the positive rate of S269- and S1208-specific cells increased only after the second injection.To further study the dynamic changes of immune responses, they performed TCR sequencing on specific CD8+ T cells selected from samples after vaccination.The results showed,The frequency of S448-specific clonotypes was higher at baseline, while S269 and S1208-specific clonotypes peaked after the second injection and re-expanded after the third injection. Additionally, S919-specific clonotypes rapidly expanded after the first injection but showed less expansion in subsequent injections.(Figure 5C,D)。These results indicate that,During the vaccination process, there may be a shift in clonal dominance between different spike epitopes.。Shifts Between Spike Epitopes Occurred in Some Participants(Figure 5E)。Figure 6 Epitope spreading of spike-specific clonotypes identified by pHLA-tetramer analysisIn addition, whether there is an epitope shift within the clonal type was also studied.The results showed that the specific responses of S269 and S919 were mainly dominated by early responders and primary responders.(Figure 6C,D)In the S448 and S1208 specific clonotypes, both early responders and major responders were observed.(Figure 6A, B)。Moreover, the total frequency of early responders is generally higher than that of primary responders after the first injection, while primary responders significantly outnumber early responders after the second injection.(Fig. 6E, F), these results are consistent with a shift in clonal dominance within the spike epitope. Some participants were also observed transitioning from early responders to primary responders.(Fig. 6G, H)。" The shift in clonal dominance induced by mRNA vaccination occurs between and within spike epitopes "
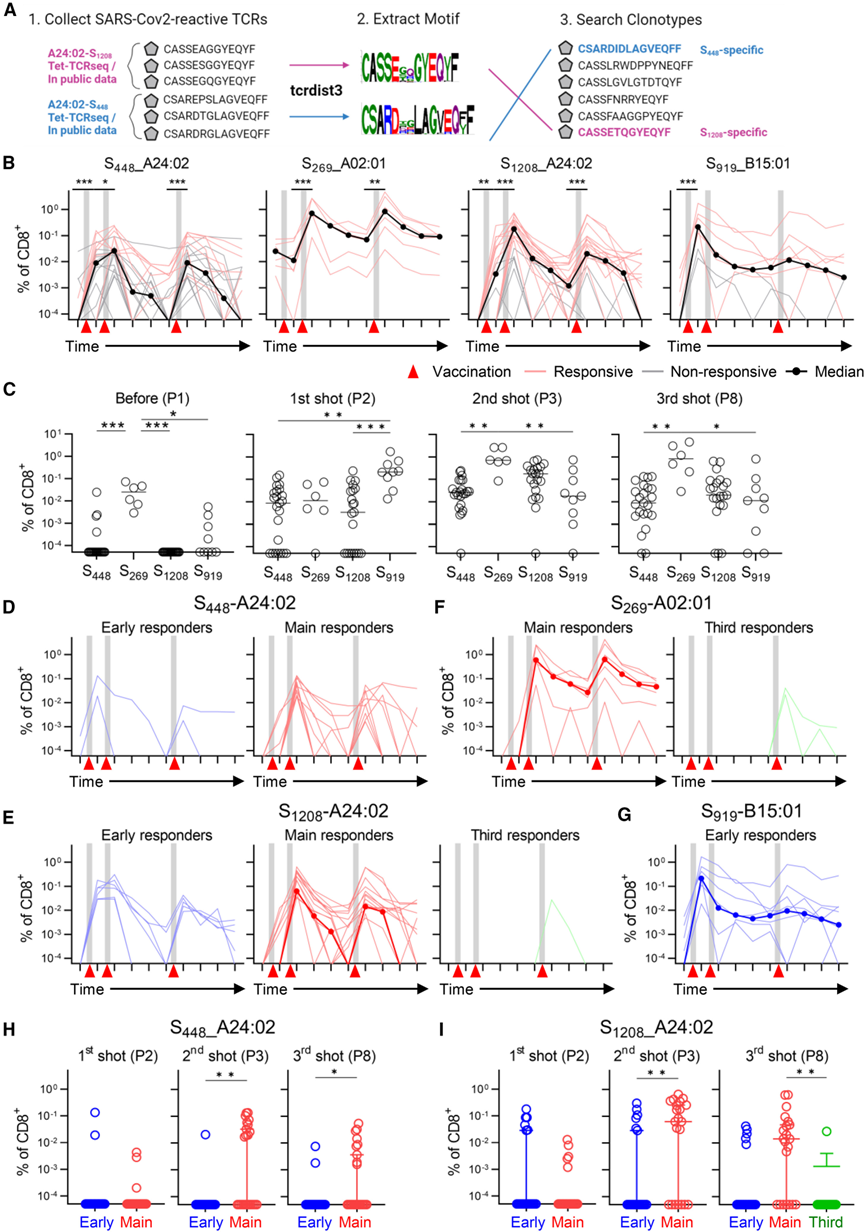
Although TCR-seq analysis revealed a shift from early responder clonotypes to dominant responder clonotypes between and within spike epitopes during vaccination, the analysis was limited by the depth of samples of tetramer+ T cells sorted from certain cells. To analyze spike-specific clonotypes, shared conserved TCR sequence motifs were subsequently utilized to identify clonotypes with identical pHLA.By using spike-specific clonotypes obtained from TCR-seq datasets and spike-specific TCRs from public databases, shared TCR sequence motifs of spike-specific clonotypes were constructed. Then, the participants' HLA alleles were used to search for T cell clonotypes with these motifs.(Figure 7A)Whether the spike-specific clonotypes identified by TCR motif analysis overlap with the clonotypes identified by TCR-seq,No clonotypes with different specificities were found to be distributed between TCR motif analysis and TCR-seq.。Figure 7 Analysis of Spike-Specific Clonotypes Using TCR Sequence MotifsThen, the temporal dynamics of T cell responses against four spike epitopes were quantified through TCR motif analysis, consistent with tetramer TCR-seq analysis.S269 and S1208-specific clonotypes exhibited a primary responder pattern, while S919-specific clonotypes displayed an early responder pattern.(Figure 7B)。Unlike the situation with tetramer TCR-seq, the S448-specific clonotype determined by TCR motifs exhibited an early response pattern but with a lower peak total frequency.After the first injection, the frequency of S919-specific clonotypes was higher than that of S1208 and S269, but after the second injection, a reversal occurred.(Figure 7C)。These results indicate that,Epitope shifts in vaccine-reactive clonotypes may occurAn epitope shift may have occurred between S919 and S269 in HLA-B15:01+A02:01 participants, as well as in HLA-B15:01+A24.:02Between S919 and S1208 of the participants.
In summary, this study shows thatClonal dominance of T cells shifts during SARS-CoV-2 mRNA vaccinationIn contrast to the humoral immunity mediated by memory B cells and long-lived plasma cells, T cells appear to be able to reestablish memory populations after repeated vaccinations.This plasticity not only sustains the quantity of memory T cells but also maintains the diversity capable of responding to different pathogen variants.,Which may enable them to effectively cope with viral variants.https://doi.org/10.1016/j.celrep.2024.113887
Scan the WeChat QR code to add.Medicine Space-TimeEditor
Please indicate: Name + Research Direction!