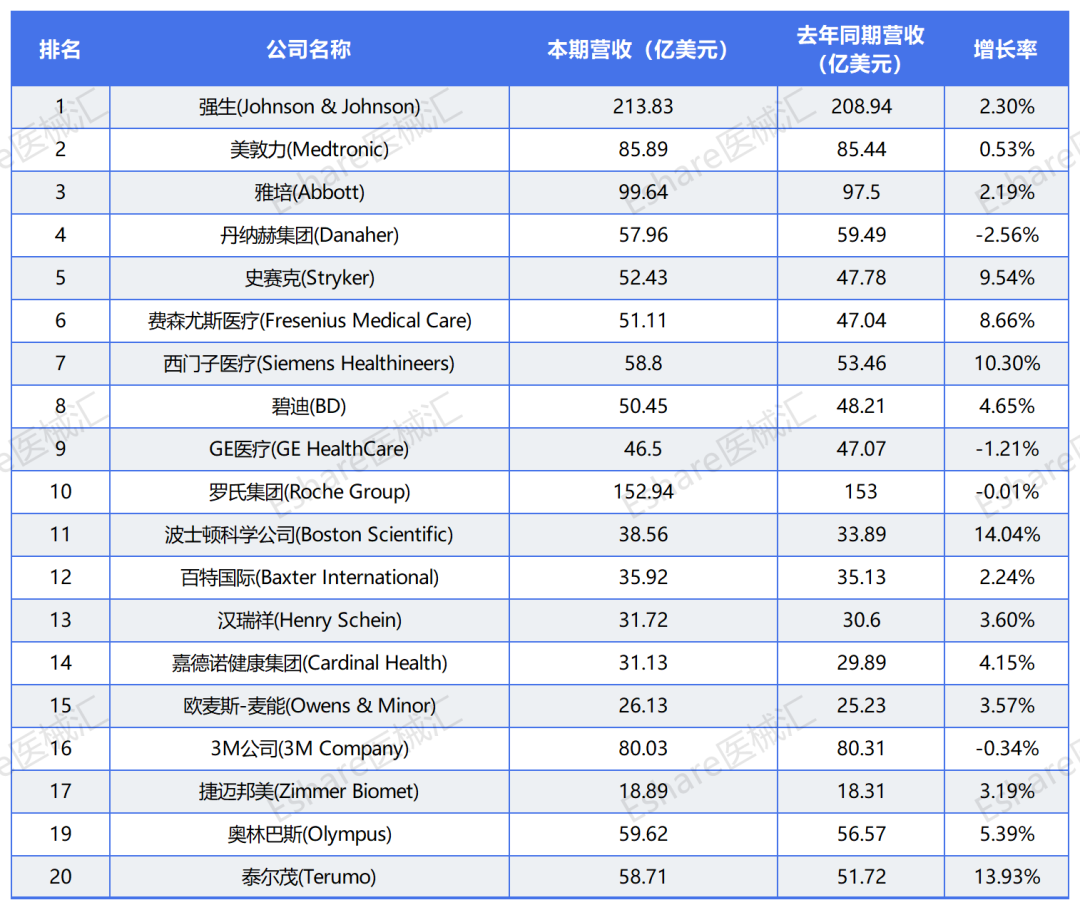
Global MedTech Top 20 Q1 Earnings Revealed: J&J Leads with $21.38B Revenue

Johnson & Johnson
Medical Device R&D and Manufacturer

Medtronic
Medical Device Manufacturer

▲Source of the article:Eshare Medical Device Hub
▲Please indicate the above source at the beginning of the article when reprinting.
Medtronic, Johnson & Johnson, Siemens... Financial Reports of 24 Global Medical Device Companies for Q1 2024 Released!
01
Johnson & Johnson:
Innovative Drug Business Q1 Revenue135.62Billion USD, a year-on-year increase of 1.1%.
Revenue in the autoimmune field42.47Billion USD, a year-on-year increase of 3.3%.
Q1 Revenue in the Oncology Field48.14Billion USD, a year-on-year increase of 17.1%.
Neuroscience Field 2024 Q1 Revenue Remains Flat Compared to Last Year, at18.03Billion US dollars.
The pulmonary arterial hypertension segment increased by 20.2% year-over-year to reach US$1.049 billion.
Full-year sales for 2024 are expected to be between $88.7 billion and $89.1 billion.
Cardiovascular Combination:
Revenue for the fourth quarter was31.30Billion USD, decreased by 5.2%, organicIncreased by 4.0%。
Structural Heart and Aortic (SHA) and Coronary and Peripheral Vascular (CPV) divisions achieved mid-single-digit organic growth.
The Cardiac Rhythm and Heart Failure (CRHF) division achieved low single-digit organic growth.
Neuroscience Product Portfolio:
Revenue for the fourth quarter was25.45billion dollars, increased by 5.6%,Organic Growth 6.5%。
The Cranial and Spinal Technologies (CST) division achieved high single-digit growth.
The Special Therapies and Neuromodulation segments achieved mid-single-digit and low-single-digit growth, respectively.
Medical Surgical Product Portfolio:
Revenue for the fourth quarter was21.98billion USD, increasing by 3.5%,Organic Growth 4.5%。
The Surgical and Endoscopic (SE) department achieved moderate single-digit organic growth.
The Acute Care and Monitoring (ACM) division achieved low single-digit organic growth.
Diabetes:
Revenue for the fourth quarter was6.6Billion USD, increased by 10.9%,Organic Growth 11.1%。
The U.S. market achieved low double-digit growth due to the continued launch of the MiniMed™ 780G system.

Medical Device Business:
Global Sales in the First Quarter:44.5"Billion US dollars,"An increase of 14.3% year-on-year。
Sales in diabetes, electrophysiology, neuromodulation, and structural heart businesses all achieved double-digit growth.
Diagnostic Services:
Global Sales in the First Quarter:22.1Billion US dollars.
Excluding the impact of COVID-19 testing products, diagnostic business sales increased year-over-year.5.4%。

4. Danaher Group (Danaher)
Diagnostic Business Group Revenue25.27Billion US dollars,An increase of 6.36% year-on-year。
Life Sciences Business Group Revenue17.45Billion USD,An increase of 2.11% year-on-year。
China 2024 Q1 Biotechnology Business Group Sales Decline by 40%.

Net Sales of MedSurg and Neurotechnology30Billion USD, This QuarterIncreased by 11.5%, an increase of 12.0% at constant exchange rates.
Orthopedics and Spine Business Net Sales22Billion US dollars,Increased by 7.5%, an increase of 8.0% at constant exchange rates.

02
In terms of net profit, 3M Company, Fujifilm Group, Olympus, and Terumo demonstrated robust net profits, while Philips experienced a significant net loss, and Bausch + Lomb reported a negative net profit.
Philips: This period's net loss was $1.434 billion. Comparable order volume decreased by 3.8%, mainly affected by the Chinese market. Respironics, a Philips business, reached a litigation settlement in the United States with a compensation amount of €982 million (approximately RMB 7.56 billion).
Diagnosis and Treatment Services:
Owens & Minor: This period's net profit is -0.22 billion US dollars.
Bausch+Lomb: This period's net profit is negative 1.67 billion US dollars.
However, the first quarter is traditionally the off-season for the medical device industry.Season, this does not mean that the industry's activities have come to a halt.On the contrary,This period may provide new opportunities for medical device companies.An opportunity to review itsStrategy, and for future growthGet ready.
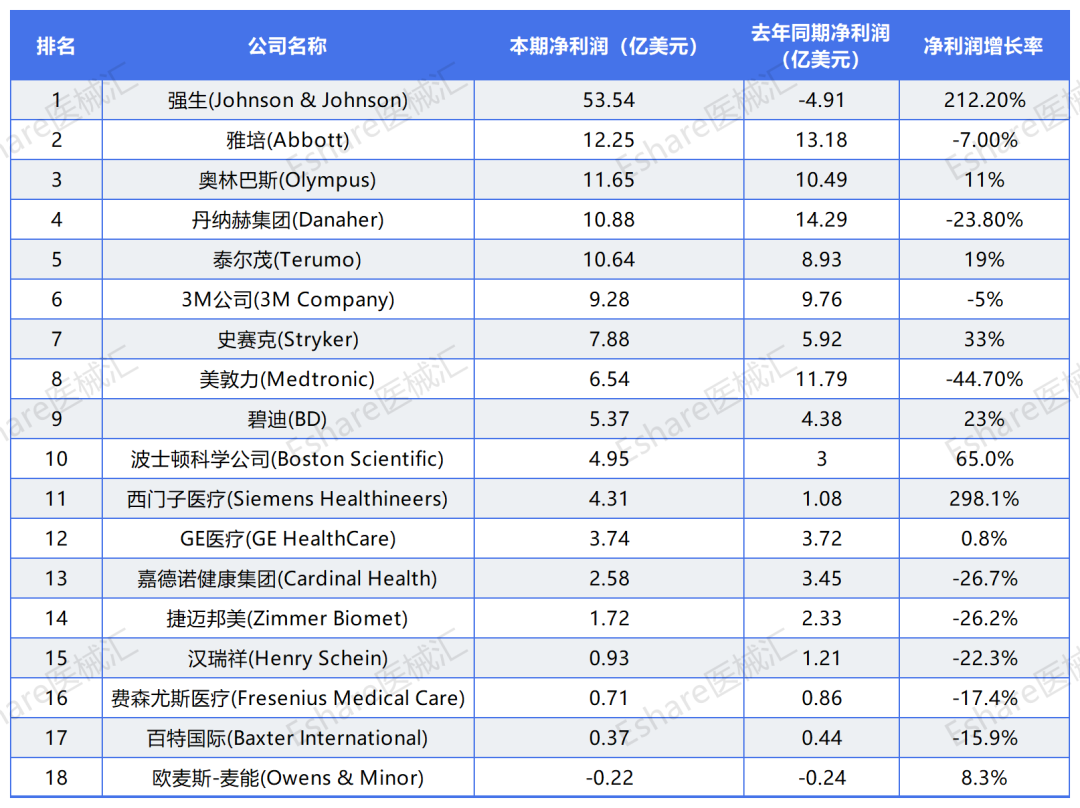
▲2024Q1 Global Medical Device Companies Net Profit Ranking
03

Fresenius Medical Care(Fresenius Medical Care) Announces First Quarter 2024 Results. Quarterly revenue was €4.725 billion (approximately $5.111 billion), compared to €4.704 billion in the same period last year. Quarterly operating profit was €246 million, compared to €261 million in the same period last year. Quarterly net profit attributable to shareholders of the company was €70.96 million, compared to €86.36 million in the same period last year.

8. BD
BD Reports First Quarter 2024 Results. Total revenue for the quarter was $5.045 billion, compared to $4.821 billion in the same period last year. Net income attributable to common shareholders for the quarter was $537 million, compared to $438 million in the same period last year.

9.GE HealthCare
GE HealthCare Reports First Quarter 2024 Results. Total revenue for the quarter was $4.65 billion, compared to $4.707 billion in the same period last year. Net income attributable to the company for the quarter was $374 million, compared to $372 million in the same period last year.

10. Philips
PhilipsAnnouncement of Q1 2024 Financial Results: Quarterly sales reached €4.138 billion (approximately $4.476 billion), compared to €4.167 billion in the same period last year. The quarterly net loss was €998 million, while the net loss in the same period last year was €665 million. Adjusted EBITDA for the quarter was €609 million, compared to €575 million in the same period last year.

11. Thermo Fisher Scientific
Thermo Fisher Scientific(Thermo Fisher Scientific) Announces First Quarter 2024 Results. Quarterly revenue was $10.345 billion, compared to $10.71 billion in the same period last year. Net income attributable to the company for the quarter was $1.328 billion, compared to $1.289 billion in the same period last year. Specifically, life sciences business revenue was $2.285 billion, laboratory products and biopharmaceutical services revenue was $5.723 billion, specialty diagnostics business revenue was $1.109 billion, and analytical instruments revenue was $1.687 billion.

12. Boston Scientific
Boston Scientific Reports First Quarter 2024 Results. Net sales for the quarter were $3.856 billion, compared to $3.389 billion in the same period last year. Net income attributable to common shareholders for the quarter was $495 million, compared to $300 million in the same period last year.

13. Roche
Roche Announces Q1 2024 Results: Group Sales Reach CHF 14.4 Billion, Down from CHF 15.3 Billion in the Same Period Last Year. Pharmaceutical Sales Amount to CHF 10.9 Billion, Compared to CHF 11.6 Billion in the Previous Year. Diagnostics Business Sales Hit CHF 3.5 Billion (Approx. USD 3.825 Billion), Down from CHF 3.7 Billion Year-on-Year.

14. Baxter International Inc.
Baxter International Inc. Announces First Quarter 2024 Results. Net sales for the quarter were $3.592 billion, compared to $3.513 billion in the same period last year. Net income attributable to shareholders for the quarter was $37 million, compared to $44 million in the same period last year.

15. Henry Schein
Henry Schein Reports First Quarter 2024 Results. Net sales for the quarter were $3.172 billion, compared to $3.06 billion in the same period last year. Net income attributable to the company for the quarter was $93 million, compared to $121 million in the same period last year.

16.Cardinal Health
Cardinal Health Reports Third Quarter Fiscal 2024 Results Ended March 31, 2024. Quarterly revenue was $54.9 billion, compared to $50.5 billion in the same period last year. Net income attributable to the company for the quarter was $258 million, compared to $345 million in the same period last year. Revenue from medical products and other businesses was $3.113 billion, compared to $2.989 billion in the same period last year.

17. Owens & Minor
Owens & Minor Reports First Quarter 2024 Results. Net revenue for the quarter was $2.613 billion, compared to $2.523 billion in the same period last year. Net loss for the quarter was $21.89 million, compared to a net loss of $24.42 million in the same period last year.

18.3M
3M Reports First Quarter 2024 Results. Net sales for the quarter were $8.003 billion, compared to $8.031 billion in the same period last year. Net income attributable to the company for the quarter was $928 million, compared to $976 million in the same period last year. By business segment, net sales for Safety and Industrial were $2.732 billion, Transportation and Electronics were $2.104 billion, Consumer were $1.14 billion. Health Care net sales were $2.017 billion, compared to $2.01 billion in the same period last year; operating profit was $354 million, compared to $360 million in the same period last year.

19. Zimmer Biomet Holdings Inc
Zimmer Biomet Holdings Inc. announced its first-quarter results for 2024. Net sales for the quarter were $1.889 billion, compared to $1.831 billion in the same period last year. The company's net profit attributable to the company for the quarter was $172 million, compared to $233 million in the same period last year.

20. Fujifilm Holdings
Fujifilm Holdings announced its fiscal year 2023 results ended March 31, 2024. The group's sales revenue increased by 3.6% year-over-year to 2,960.9 billion yen. Operating profit reached 276.7 billion yen, a year-over-year increase of 1.3%. Net profit attributable to Fujifilm Holdings increased by 11.0% year-over-year to 243.5 billion yen. By business segment, Healthcare sales revenue amounted to 975.1 billion yen (approximately 6.21 billion USD), with an operating profit of 97.4 billion yen. High-performance materials sales revenue reached 690 billion yen, with an operating profit of 42.9 billion yen. Imaging sales revenue totaled 469.7 billion yen, with an operating profit of 101.9 billion yen. Total sales in the Business Innovation segment were 826.1 billion yen, with an operating profit of 70.8 billion yen.

21. Olympus (OLYMPUS)
Olympus Releases Financial Results for the Fiscal Year Ended March 31, 2024. Revenue for the fiscal year was 936.2 billion yen (approximately $5.962 billion USD), compared to 881.9 billion yen the previous year, representing a year-over-year increase of 6.2%. Operating profit for the fiscal year was 43.6 billion yen, compared to 186.6 billion yen the previous year. Net profit attributable to owners of the parent company for the fiscal year was 242.6 billion yen, compared to 143.4 billion yen the previous year.

22. Terumo
Terumo Releases Financial Results for the Fiscal Year Ended March 31, 2024. Revenue for the fiscal year was 921.9 billion yen (approximately 5.871 billion USD), compared to 820.2 billion yen the previous year, representing a year-on-year increase of 12.4%. Operating profit for the fiscal year was 140.1 billion yen, compared to 117.3 billion yen the previous year. Net profit attributable to owners of the parent company for the fiscal year was 106.4 billion yen, compared to 89.3 billion yen the previous year.

23. Mindray Medical
Mindray Discloses Q1 2024 Earnings Report. In Q1, revenue reached 9.373 billion yuan (approximately 1.294 billion USD), a year-on-year increase of 12.06%; Net profit attributable to shareholders of the listed company was 3.16 billion yuan, a year-on-year growth of 22.90%. R&D investment in Q1 was 1.03 billion yuan, accounting for 10.99% of total revenue.

24. Canon Group (Canon)
Canon Group Releases Q1 2024 Financial Report. The group's revenue for the quarter was 988.519 billion yen, compared to 971.125 billion yen in the same period last year, representing a year-on-year increase of 1.8%. The operating profit for the quarter was 80.083 billion yen, compared to 84.475 billion yen in the same period last year. Net profit attributable to the company for the quarter was 59.949 billion yen, compared to 56.41 billion yen in the same period last year. Among these figures, printing business revenue increased by 4.0% year-on-year to 580.3 billion yen. Medical business revenue grew by 2.4% year-on-year to 134.2 billion yen (approximately 855 million U.S. dollars). Imaging business revenue decreased by 8.8% year-on-year to 175.5 billion yen. Industrial business revenue increased by 10.4% year-on-year to 68.5 billion yen.
Note:The starting time of the fiscal year for major companies differs from the calendar year, leading to inconsistencies between fiscal quarters, fiscal years, and the natural year. Companies may announce their performance results on a quarterly or semi-annual basis. All data was collected as of May 28, 2024, and the exact revenue figures for each company are subject to fluctuations in exchange rates.
The above content is for reference only and does not constitute investment advice. Due to the manual data collection, there might be some information gaps. If there are any issues, please contact us in time. Thanks for your corrections. Content is sourced from publicly available online materials.