Among 10 Medical IT Listed Companies Reporting 2016 Preliminary Results, WinHealth Stands Out with Exceptional Performance

Since March, many listed companies have successively released their 2016 annual performance forecasts. In this regard,VCBeat has promptly compiled relevant data on 10 healthcare IT companies.Although the annual report has not yet been released, a general overview of the company’s overall operational performance last year can still be gleaned from its preliminary earnings announcement.
Overall, with the exception of Heren Technology, which had just listed on the ChiNext board in October of last year, and Yilianzhong, healthcare IT companies have demonstrated a general upward trend in revenue. Among them, Winning Health achieved the highest growth rate, with both profit growth and total profit increase exceeding 100%.
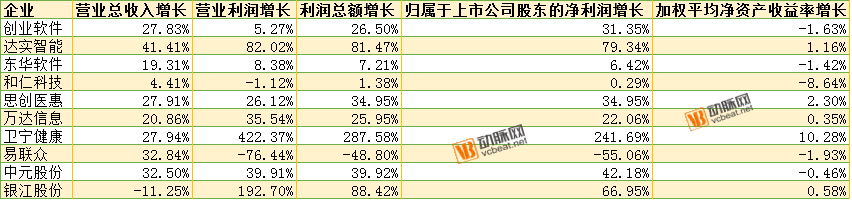
Key Financial Data and Indicators of 10 Listed Companies in 2016 Data Source: 2016 Annual Performance Expresses of the Respective Companies
In terms of business operations, multiple companies—including Das Intellitech, Donghua Software, SinoCare, and Wanda Information—have been heavily investing in the development of smart cities and smart healthcare. As the market expands, its impact on revenue is becoming increasingly significant.
In addition, 10 healthcare IT companies'Weighted Average Return on Equity (ROE)Overall relatively low, with half being negative; only Winning HealthThe share of domestic enterprises exceeded 10%, reaching 10.28%.
Winning Health
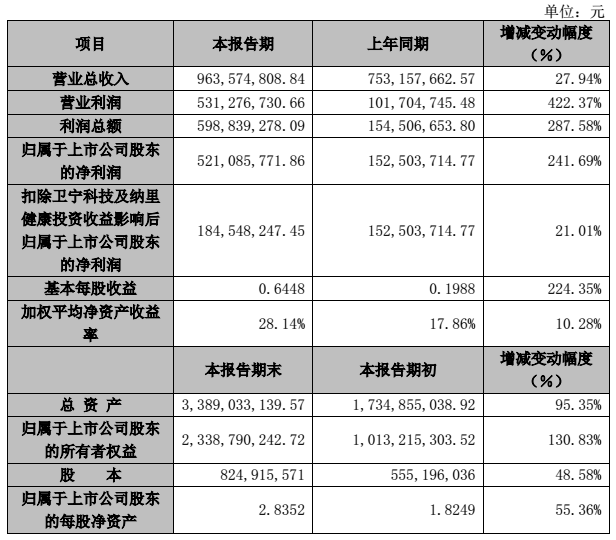
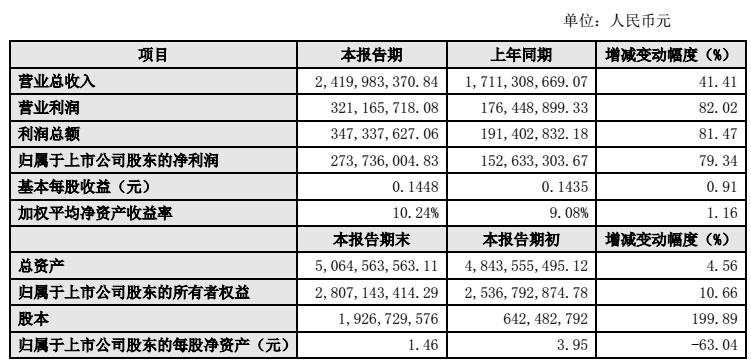
Key Financial Data and Indicators of the Company in 2016Data Source: Winning Health's 2016 Annual Performance Flash Report
According to Winning Health’s earnings flash report, the primary reasons for the year-on-year growth in the aforementioned indicators are as follows: The company has implemented its goal of coordinated development across all business segments, deepened its strategy of pursuing both organic growth and external expansion, continuously promoted the integration and innovation of business and technology within the healthcare sector, focused on vertical industry segments, optimized management models and resource allocation, enhanced project delivery capabilities, maximized customer value, and thereby driven sustained and healthy growth in its operational performance.
The estimated impact of non-recurring gains and losses on net profit for the current reporting period is RMB 355.019 million, compared with RMB 13.51 million in the same period last year. The primary reasons for the increase are as follows:
(1) Winning Health Technology Group introduced strategic shareholders, and the investment income recognized in accordance with the relevant provisions of the Accounting Standards for Business Enterprises is expected to have an impact of approximately RMB 347.4 million on net profit.
(2) As a result of gaining control over Nali Health, an investee not under common control, through additional investment, the investment income recognized in accordance with the relevant provisions of the Accounting Standards for Business Enterprises is expected to have an impact of approximately RMB -10.86 million on net profit.
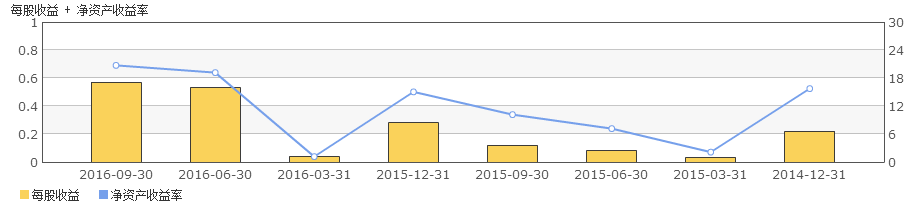
Winning Health’s Return on Equity (ROE) Trend | Data Source: Stock Star
VCBeat observed from the trend chart of Winning Health’s earnings per share (EPS) and return on equity (ROE) that between March and July 2016, Winning Health’s ROE exhibited exponential growth. AndAccording to Winning Health's third-quarter report for 2016, its asset-liability ratio was 25.81%, which falls within the normal range.
In the first half of last year, the gross profit margins of Winning Health’s software and technical services reached 74.04% and 50.14%, respectively, dataImpressive.

Winning Health’s Revenue Statement for the First Half of 2016Data Source: Winning Health 2016 Semi-Annual Report
According to an analysis in a research report by Ping An Securities, as the national promotion of hospital electronic medical record (EMR) application level assessments and interoperability tests deepens, healthcare institutions at all levels have launched a new round of healthcare informatization construction. The market size is estimated to be around RMB 500 billion. It is projected that the annual revenue growth rate for Winning Health’s healthcare informatization business will continue to maintain approximately 30%.
Precise Deployment in Medical Big Data with Clear Competitive Advantages: Leveraging its existing user base of over 4,000 healthcare institutions, Winning Health has entered four blue-ocean markets—medical health services, patient services, pharmaceutical services, and insurance services—through its “4+1” strategy, tapping into a market space valued at trillions of yuan. These four business segments are clearly delineated yet mutually synergistic. As these initiatives advance, the company’s market capitalization is expected to reach RMB 50 billion.
B-Soft
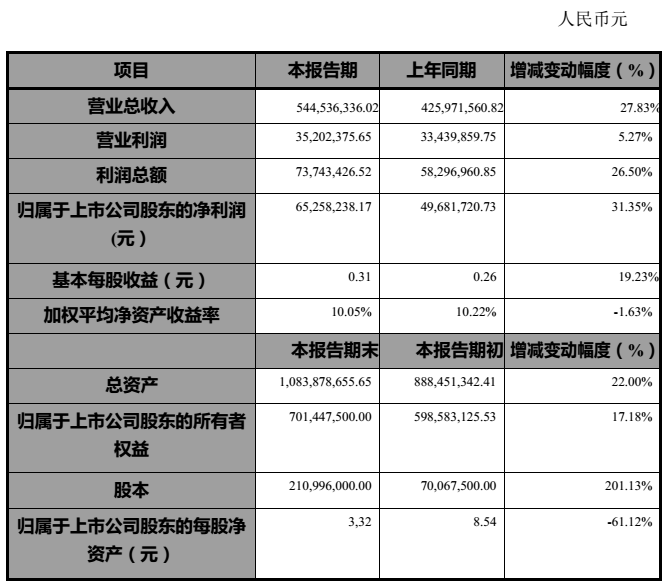
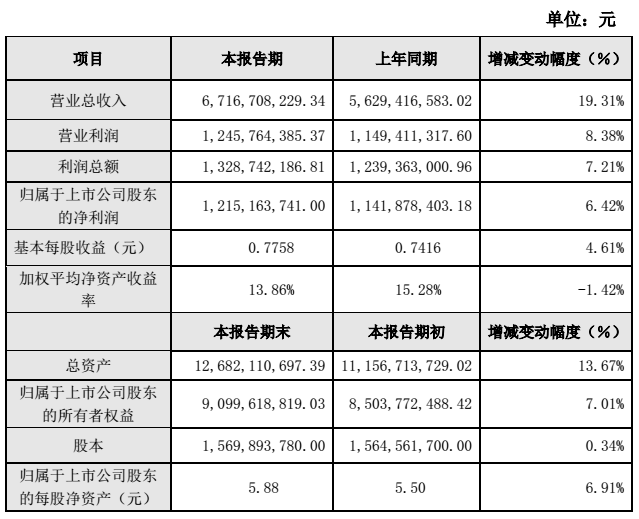
Key Financial Data and Indicators of the Company in 2016Data Source: B-Soft’s 2016 Preliminary Earnings Release
During the reporting period, the Company achieved operating revenue of RMB 544.5363 million, representing a year-on-year increase of 27.83%, primarily driven by the growth in sales of healthcare IT application software; realized an operating profit of RMB 35.2024 million, a year-on-year increase of 5.27%; achieved a total profit of RMB 73.7434 million, a year-on-year increase of 26.50%; and realized net profit attributable to shareholders of the listed company of RMB 65.2582 million, a year-on-year increase of 31.35%, mainly attributable to the increased sales of healthcare IT application software with higher gross margins. The weighted average return on equity (ROE) was 10.05%, representing a year-on-year decrease of 1.63 percentage points.
Das Intelligences
Key Financial Data and Indicators of the Company in 2016 Data Source: Das Intellitech 2016 Annual Performance Flash Report
In 2016, Das Intellitech consistently adhered to its corporate mission of “making cities smarter and buildings more energy-efficient.” By closely monitoring market dynamics and seizing industry opportunities, the company actively adjusted its business layout around three key segments—smart healthcare, smart transportation, and smart buildings—achieving rapid growth in overall performance.
The primary factors affecting the operating performance of Das Intellitech are:
(1) The Company actively implemented its strategic layout and optimized its business structure, resulting in rapid growth of its core business; the gross profit margin increased from 28.73% in 2015 to 30.70% in 2016;
(2) The financial results of Jiangsu Jiuxin Medical Technology Co., Ltd. (“Jiuxin Medical”), which the Company acquired in 2015 through the issuance of shares and cash payments, were included in the consolidated financial statements for the entire current reporting period.
In the aforementioned financial data, total operating revenue, operating profit, total profit, and net profit attributable to shareholders of the listed company all increased by more than 30% compared with the same period last year. This was mainly due to the substantial growth in the Company’s smart healthcare and smart transportation businesses during the current reporting period, as well as the inclusion of Jiuxin Medical’s full-year performance for the current reporting period in the consolidated financial statements.
Donghua Software
Key Financial Data and Indicators of the Company in 2016Data Source: Donghua Software's 2016 Annual Performance Flash Report
During the reporting period, a stable customer base enhanced the Company’s competitive advantage to a certain extent, driving sustained growth in its performance. Building on this foundation, the Company actively aligned with current market demands, continuously expanding its business scope while remaining focused on its core operations and maintaining steady development across various industries.
On one hand, the company is actively deploying in the internet sector, continuously advancing its strategic layout for smart cities across China and gradually expanding its market share. On the other hand, the company has undertaken relevant initiatives in fields such as the Internet of Things (IoT) and precision medicine. Collaborations with various partners have generated new market growth, facilitating the company’s expansion and enhancing its profitability.
Heren Technology
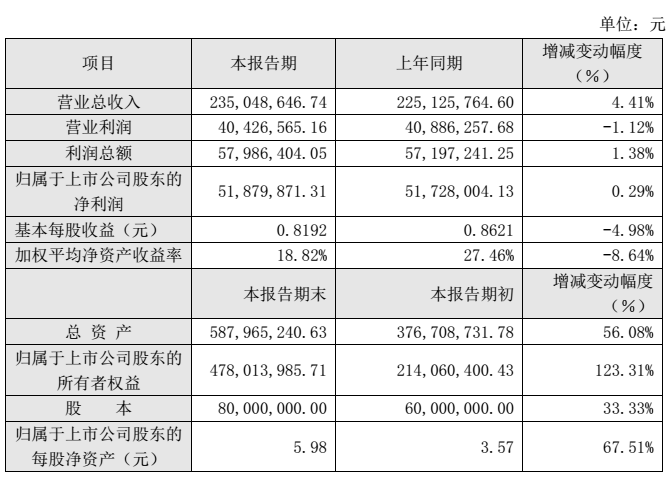
Key Financial Data and Indicators of the Company in 2016Data Source: Heren Technology's 2016 Annual Performance Flash Report
During the reporting period, the Company’s overall operational performance was sound, with business continuing to develop steadily. It achieved operating revenue of RMB 235.0486 million, representing a year-on-year increase of 4.41%; operating profit amounted to RMB 40.4266 million, a year-on-year decrease of 1.12%; and net profit reached RMB 51.8799 million, a year-on-year increase of 0.29%.
As of the end of the reporting period, the Company’s total assets amounted to RMB 587.9652 million, representing an increase of 56.08% from the beginning of the period; equity attributable to shareholders of the listed company stood at RMB 478.0140 million, up by 123.31% from the beginning of the period; share capital totaled 80.00 million shares, an increase of 33.33% from the beginning of the period; and net asset value per share attributable to shareholders of the listed company was RMB 5.98, reflecting a growth of 67.51% from the beginning of the period. The primary reasons for the growth in the aforementioned indicators were the Company’s initial public offering (IPO) and the increase in net profit.
Eco-Health
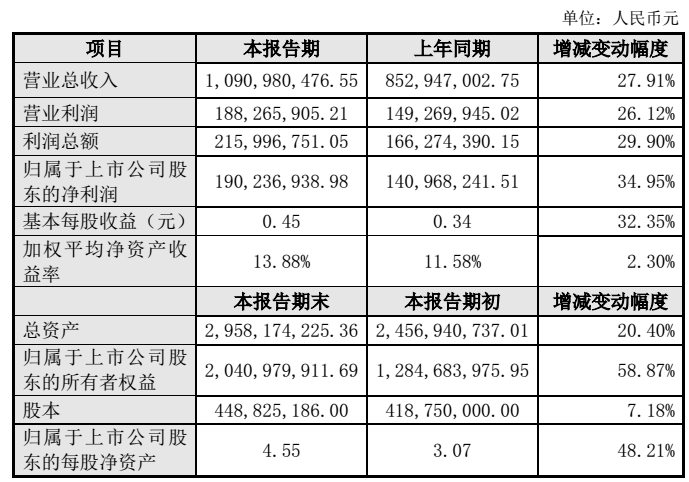
Key Financial Data and Indicators of the Company in 2016Data Source: Sunway E-Healthcare’s 2016 Preliminary Performance Announcement
In 2016, the Company continued to deepen its engagement in its two core business segments—smart healthcare and business intelligence—with overall core operations demonstrating stable growth. According to the Company’s preliminary estimates, its wholly-owned subsidiary, YiHui Technology Co., Ltd., is expected to exceed its committed performance targets for the fiscal year 2016. Meanwhile, driven by positive factors such as rising market demand and increased production volume, sales revenue from RFID tags achieved significant growth.
In addition, due to the implementation of major asset acquisitions and additional bank loans to supplement operating capital, the Company’s financial costs increased significantly in 2016, which had a certain adverse impact on its performance for the period.
In 2016, three of the aforementioned key financial indicators of the Company changed by more than 30%. The details are as follows: The net profit attributable to shareholders of the listed company during the reporting period was RMB 190.2369 million, representing a year-on-year increase of 34.95%, primarily due to the stable growth in revenue from the Company’s two core businesses, smart healthcare and business intelligence. The owners’ equity attributable to shareholders of the listed company amounted to RMB 2,040.9799 million, a year-on-year increase of 58.87%, and the net assets per share attributable to shareholders of the listed company reached RMB 4.55, a year-on-year increase of 48.21%. Both increases were mainly attributable to the registration and confirmation of new shares issued through the Company’s 2015 private placement of shares during the reporting period.
Wonders Information
Key Financial Data and Indicators of the Company in 2016 Data Source: Wonders Information’s 2016 Preliminary Earnings Report
During the reporting period, the Company continued to uphold its mission of “connecting people with services to promote social progress” and fully committed to advancing the “Healthy China” initiative. It actively cultivated various sectors aligned with “Healthy China,” including smart healthcare, safe city development, smart government services, market regulation, technological environmental protection, and food safety, thereby steadily enhancing its brand influence across China. The Company achieved significant results in expanding its nationwide market, with all key operating indicators registering stable year-on-year growth.
The synchronized growth in total operating revenue, total profit, and net profit during the reporting period was attributable to the companyAround“Connectivity, Integration, Intelligence”: Three Key Words Actively Promoting Strategic Upgrading.
Yilianzhong
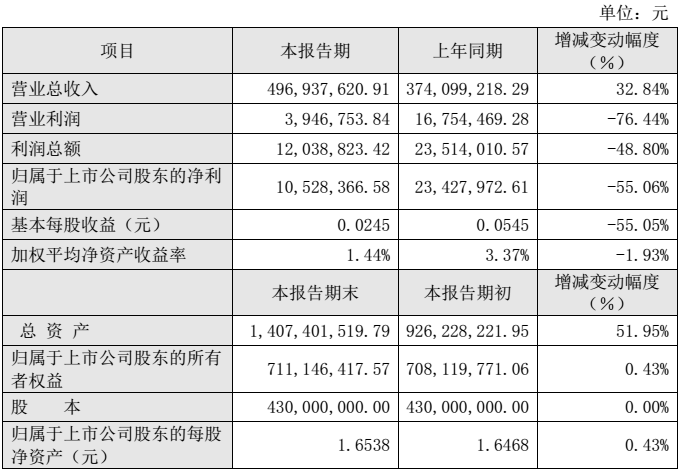
Key Financial Data and Indicators of the Company in 2016Data Source: Yilianzhong's 2016 Annual Performance Express
The primary reasons for the year-on-year decline in the aforementioned indicators: In 2016, the Company further increased its investment in medical services and other projects.expansion of personnel scale, the company's administrative expenses increased compared to the previous year; meanwhile, the company's accounts receivable grew rapidly during the current year.resulting in a significant year-on-year increase in the provision for bad debts, thereby resulting in the net profit attributable to shareholders of the listed company for the current yeara decline.
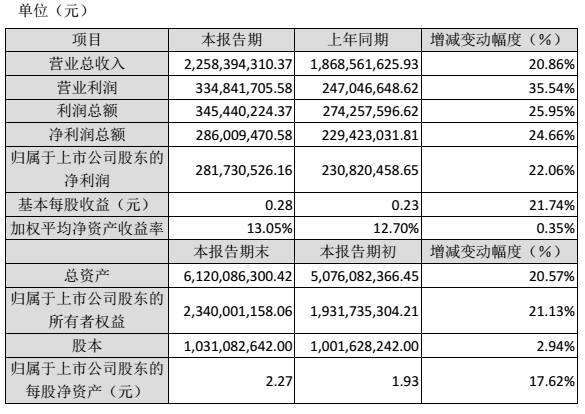
Total Assets at the End of the Reporting PeriodRMB 1,407.4015 million, a year-on-year increase of 51.95%; equity attributable to shareholders of the listed company amounted to RMB 711.1464 million, a year-on-year increase of 0.43%; net assets per share attributable to shareholders of the listed company were RMB 1.6538, a year-on-year increase of 0.43%. The primary reasons for the 51.95% year-on-year increase in total assets were a significant rise in accounts receivable and an increase in equity investments during the reporting period.
Zhongyuan Shares
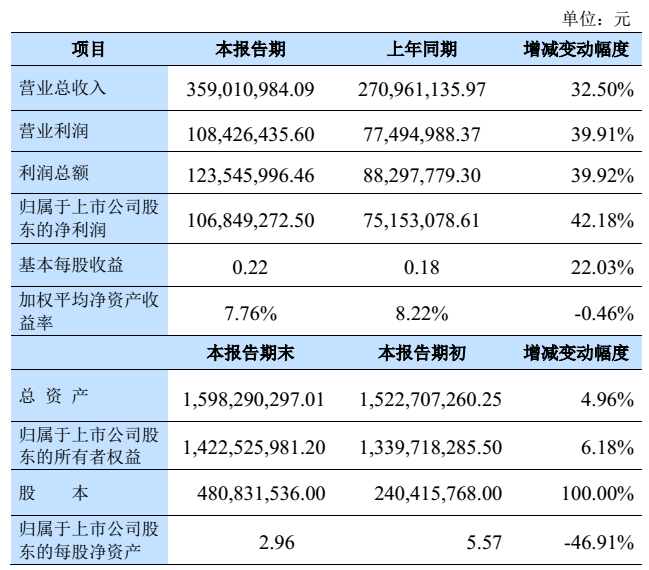
The Company’s Key Financial Data and Indicators for 2016Data Source: Zhongyuan Shares’ 2016 Annual Performance Flash Report
During the reporting period, the growth in the Company’s operating revenue, operating profit, total profit, and net profit attributable to shareholders of the listed company was primarily due to the consolidation of the full-year operating results (from January to December) of its wholly-owned subsidiary, Jiangsu Shixuan Technology Co., Ltd.
At the end of the reporting period, the company's total assets wereRMB 1,598,290,297.01, an increase of 4.96% from the beginning of the reporting period; equity attributable to shareholders of the listed company amounted to RMB 1,422,525,981.20, an increase of 6.18% from the beginning of the reporting period. The primary reason was profitability achieved during the current year.
Yinjiang Co., Ltd.
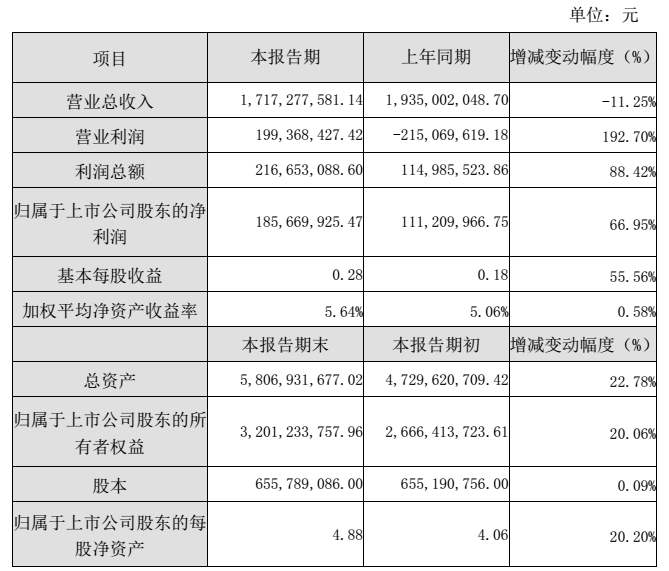
The Company’s Key Financial Data and Indicators for 2016Data Source: Yinjiang Shares’ 2016 Annual Performance Flash Report
The primary reasons for the growth in the aforementioned performance indicators are:
During the reporting period, Zhejiang Jinke Entertainment Culture Co., Ltd. (hereinafter referred to as “Jinke Entertainment”) acquired 100% of the equity interest in Hangzhou Zhexin Information Technology Co., Ltd., in which the Company held a minority stake. The consideration received by the Company from Jinke Entertainment comprised RMB 69.6 million in cash and available-for-sale financial assets valued at RMB 154.28 million (representing 29,330,796 shares of Jinke Entertainment), resulting in an increase in the total profit for the current period of approximately RMB 122.88 million.
The company's other non-recurring gains and losses for the fiscal year 2016 are estimated to range from RMB 9 million to RMB 15 million.Basic earnings per share during the reporting period amounted to RMB 0.28, representing a year-on-year increase of 55.56%, primarily attributable to the growth in total profit.