Industry Recognizes Maturity of Deep Convolutional Networks: AI Era Arrives for Pulmonary Nodule Detection
Lung cancer causes the highest number of deaths among all cancers in both men and women. Statistics show that in 2016, lung cancer accounted for 27% of all cancer-related deaths in the United States. Early screening is a critical measure to reduce mortality. However, since patients with early-stage lung cancer typically lack obvious clinical symptoms and specific biomarkers, the primary screening method currently relies on radiological imaging to detect suspicious pulmonary lesions.
The most commonly used techniques in chest radiological imaging include X-ray fluoroscopy and CT scans of the thorax. Compared to the flat, two-dimensional images produced by X-ray fluoroscopy, CT provides three-dimensional information of the thoracic cavity, resulting in significantly higher screening accuracy than X-rays.
Low-dose CT scanning is highly suitable for annual health checkups due to its rapid scan speed (average operation time per examinee does not exceed one minute), low cost, and minimal radiation exposure. A multi-year national lung screening study in the United States, the National Lung Screening Trial, demonstrated that annual chest examinations using low-dose CT in high-risk populations (older individuals with a history of smoking or family medical history) resulted in a 20% lower lung cancer mortality rate over seven years compared to those undergoing conventional chest fluoroscopy.
Due to the excellent screening efficacy of low-dose CT scans, this screening method has gradually become a routine component of health checkups in the United States, and it is expected that other countries will also progressively adopt and promote its use.
A major obstacle to promoting this screening effort is the enormous workload involved in CT image interpretation. Early-stage lung cancer often presents as pulmonary nodules, which are small in size, have low contrast, and exhibit high heterogeneity in shape; consequently, screening relies on manual image review by radiology specialists. However, each patient’s chest CT scan comprises at least 100 images, with high-resolution scans yielding up to 600 images. As the number of individuals undergoing health examinations grows rapidly, manual processing is increasingly unable to meet the demands of this task.
Over the past decade, numerous computer-aided diagnosis (CAD) systems for CT screening of pulmonary nodules have been developed. Representative publicly available systems include ISICAD, SubsolidCAD, LargeCAD, and ETROCAD. These CAD systems typically involve three steps: 1. Image data preprocessing; 2. Generation of a candidate nodule set; 3. Reduction of false positives in the candidate set.
Step 1 involves standardizing the input images by fixing the image resolution and slice spacing, segmenting lung tissue while excluding other regions, and reducing data noise. Step 2 aims to detect as many nodule regions as possible within the images using various algorithms. To enhance the algorithm’s sensitivity to nodules, strict control over the false positive rate is generally not required at this stage. The objective of Step 3 is to eliminate non-nodule cases from the candidate set generated in the previous step, thereby reducing the system’s false positive rate. The main methods for each step are described below:
Image Preprocessing
The preprocessing steps adopted by various CAD systems in this phase are essentially consistent, encompassing the following tasks:
a. Import CT data files that meet the requirements (typically DICOM files) into the system, and reject data with incorrect formats or gaps in scan slices;
b. Convert the data to standard Hounsfield units for CT signals;
c. Adjust the slice spacing to ensure consistent true physical spacing (in millimeters) between all pixels;
d. Segment the lung regions and exclude values from non-lung areas to prevent noise signals from these regions.
Following these processes, the system will obtain a set of clean input data.
Establish a Set of Suspected Nodules
Different CAD systems employ varying methods for identifying suspected nodules. The commonly used approaches include the following:
1. ISICAD: The recognition method employed in this system was designed by Murphy K. et al. (doi:10.1016/j.media.2009.07.001). They defined two nodule-related metrics: the Shape Index (SI) and Curvedness (CI).
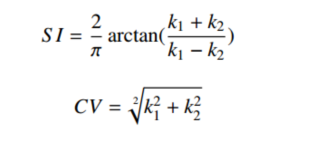
By calculating the SI and CI for each layer of CT images and applying threshold-based filtering, the system can identify “seed” regions of suspected lesions. Subsequently, by merging “seed” regions that are in close proximity, the system establishes a complete set of suspected nodules.
2. SubSolidCAD: This system is primarily designed for part-solid pulmonary nodules. Although part-solid nodules are less common, they have a higher likelihood of being malignant; therefore, such nodules must not be missed. Jacobs C. et al. (doi:10.1016/j.media.2013.12.001) developed a dual-threshold filtering method targeting density regions between -750 and -300 Hounsfield Units. To mitigate the impact of boundary effects, the system employs visual algorithms to eliminate these artifacts. Finally, the system excludes suspicious regions with a total volume smaller than 33 mm³, as these small nodules pose minimal risk and generally do not require patient follow-up.
3. LargeCAD: This system is primarily designed for larger nodules that cannot be detected by the aforementioned two methods, specifically those with a diameter greater than 10 mm. For such nodules, Setio A. et al. (doi:10.1118/1.4929562) applied a threshold of -300 Hounsfield Units and employed multiple machine vision algorithms to process the images, merging connected suspicious regions. Finally, all candidate regions with diameters between 8 and 40 mm were output as suspicious areas.
4. ETROCAD: This system, designed by Tan M. et al. (doi:10.1118/1.3633941), demonstrates significant efficacy in identifying nodular tissues attached to the vascular wall or pleural wall. Unlike isolated nodules, nodules adjacent to the vascular or pleural walls exhibit diverse morphologies, resulting in low recognition rates for the aforementioned methods. This system employs two sets of filter algorithms to enhance both the nodular tissue and the vascular (or pleural) wall. By calculating the difference between the enhanced image and the original image and applying an appropriate threshold, the center position of the nodular tissue can be localized. Finally, nearby center positions are merged to identify all suspicious regions.
The aforementioned detection systems are all based on traditional machine vision algorithms. With the widespread application of artificial intelligence, AI algorithms represented by deep convolutional networks have also emerged successively, such as ReCTnet and ZNET. The detection methods are as follows:
5. ReCTnet: A method designed by Ypsilantis P. et al. that integrates two of the most important network architectures in the field of deep learning—convolutional networks and recurrent networks (arXiv:1609.09143v2). This approach enables the learning of both intra-image features within each scan and sequential features across adjacent image slices. The authors first employed a convolutional neural network to train a classifier capable of distinguishing whether subregions within a single image slice contain nodules. They then incorporated adjacent upper and lower slices from the CT scans and utilized a recurrent network to optimize this classifier.
During diagnosis, the entire CT image set is fed into the system. The trained classifier scans each subregion of every slice to calculate the probability of nodules being present, thereby generating a 3D probability map. Finally, an appropriate threshold is applied to output high-risk regions from the 3D map. Even without subsequent false-positive reduction steps, this system achieves a sensitivity of 90% with a false-positive rate of 4.5 per CT scan.
6. ZNET: This system is based on the U-Net architecture designed by Ronneberger O. et al. (doi:10.1007/978-3-319-24574-4_28). U-Net is a deep convolutional network for pixel-level image segmentation, particularly well-suited for biological and medical imaging applications. The ZNET system utilizes the probabilities output by U-Net indicating whether each pixel belongs to a nodule to construct pixel-wise probability maps for each CT slice. An appropriate threshold is then selected to delineate high-risk regions. Subsequently, machine vision algorithms are employed to merge these regions, yielding the final set of suspected regions.
Reducing False Positives in the Suspected Set
If artificial intelligence and traditional machine vision algorithms are comparable in sensitivity for the detection of pulmonary nodules, the field of eliminating false-positive nodules is now entirely dominated by AI. Traditional pattern recognition methods have very limited selectivity for small to medium-sized nodules with variable shapes and numerous mimics. Representative AI algorithms include the following:
1. CUMedVis: A 3D deep convolutional neural network designed by Dou Q. et al. from The Chinese University of Hong Kong (doi:10.1109/TBME.2016.2613502). Compared with corresponding 2D CNNs, 3D CNNs can integrate richer spatial information and extract more representative latent features through their hierarchical structures. The authors employed three different 3D CNN architectures, each with distinct input sizes and internal structures, to process volumetric CT image data. By applying these three networks to the same spatial region in CT images, the probabilities P1, P2, and P3 that the region contains a pulmonary nodule were calculated. The final probability P indicating whether the region contains a pulmonary nodule was computed using a simple linear combination: P = 30%*P1 + 40%*P2 + 30%*P3. A threshold was set such that if the probability P fell below this threshold, the detection was classified as a false positive. The authors' method addressed the challenges posed by the significant heterogeneity of pulmonary nodules and the presence of numerous similar structures in medical images.
2. DIAG CONVNET: A multi-view 2D deep convolutional network designed by Setio A. et al. (doi:10.1109/TMI.2016.2536809). For each candidate region within the set of suspected regions, 50×50 mm sub-images are extracted from three orthogonal directions (length, width, and height), along with two adjacent slices of equal size preceding and following each central slice, resulting in a total of nine images. For each image, a 2D deep convolutional network is applied for feature extraction, followed by fully connected layers to reduce dimensionality to 16 features. Finally, the model performs classification based on the combined 144 features derived from the nine sub-images to determine the probability that the region contains a nodule. A threshold is set; if the probability p is below this threshold, the region is classified as a false positive.
3. CADIMI: Designed by Bel T. et al. (no paper published yet). For the center of each suspicious region, three sub-images (anterior, middle, and posterior) are extracted from each dimensional direction and used as the three channels of a single image input to train a deep neural network. During evaluation, the test slice and its four adjacent slices (totaling five slices, with minor shifts to align their centers) are simultaneously processed to calculate the probability of containing a nodule; the average of these five probabilities is taken as the final probability. A threshold is similarly set; if the probability p is below the threshold, the result is classified as a false positive.
In addition to the three aforementioned methods, ReCTnet and ZNET, introduced in the previous step, are also false-positive detection methods. Due to the inherent characteristics of artificial intelligence, nodule detection involves calculating the probability that a given region is a nodule; therefore, the results of detection and screening are generated simultaneously.
To enhance the system’s detection capabilities, lung nodule computer-aided diagnosis systems will evolve toward multi-model integration. For instance, during the step of establishing a set of suspected cases, simply combining the results from several algorithms can increase the system’s sensitivity to various types of nodules. Since each model has its own applicable scope, integrating them can broaden the overall applicability.
However, for the false-positive screening step, simple merging or averaging of multi-model results does not necessarily enhance model selectivity. It is necessary to employ a systematic approach to evaluate the selection capability of each model under various conditions and establish their respective applicability criteria, thereby more effectively reducing the false-positive rate.
Furthermore, with the rapid advancement of artificial intelligence algorithms, an increasing number of sophisticated algorithms are being developed to enhance the accuracy of existing methods. For instance, regarding the CUMedVis method mentioned earlier, its authors reported two months later that they had upgraded the neural network within the model to a residual neural network (ResNet), thereby further improving the false positive detection success rate by 2 percentage points.
Finally, the training of artificial intelligence models will gradually shift from strong supervised learning, which requires annotated lesion regions, to weak supervised learning based solely on annotated diagnostic outcomes. In relevant competitions hosted on Kaggle, the training datasets no longer provide annotations for lesion areas; instead, they simply indicate whether each patient corresponding to a CT scan actually has lung cancer.
Artificial intelligence models autonomously learn the correlation between imaging features and clinical lung cancer diagnoses from CT image data. This approach requires minimal human effort for weakly labeled data, making it highly suitable for constructing large-scale training datasets. Similar to AlphaGo in the game of Go, only AI models trained on extensive datasets possess superior detection capabilities, thereby playing a substantive role in clinical diagnosis and contributing to the advancement of human health.
Author Biography: Tao Jin is a Distinguished Researcher at the Institute of Information, College of Pharmaceutical Sciences, Zhejiang University, and the founder of Hangzhou Dawei Information Technology Co., Ltd. Established in 2016, Dawei specializes in applying artificial intelligence to medical image analysis. The company’s current primary development project is a computer-aided diagnosis (CAD) system for chest examination images, including X-ray fluoroscopy and CT scans. The goal is to classify examination cases as extensively as possible, filtering out those that are clearly normal or pathological, thereby allowing radiology professionals to focus their efforts on the remaining complex cases. As algorithms continue to improve, the range of cases supported by AI-assisted decision-making is expanding, gradually reducing the volume of images requiring interpretation by specialists and significantly accelerating the overall workflow of image diagnosis.