A Comprehensive Analysis of Revenue, Profitability, R&D Investment, and Strategic Trends Across 130 Listed Pharmaceutical Companies Based on Annual Reports
Listed companies are the best window into an industry, and annual reports are the optimal entry point for understanding a company.VCBeat (WeChat ID: vcbeat) selected 113 A-share listed pharmaceutical companies with published annual report data, along with 17 H-share listed pharmaceutical companies (companies listed on both A-shares and H-shares are counted as A-shares). The article provides a multi-dimensional analysis of these 130 listed pharmaceutical enterprises from perspectives including revenue, net profit and growth rates, R&D investment, and core strategies, offering insights into the pharmaceutical industry.
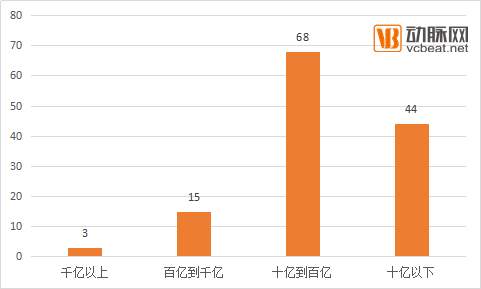
Revenue: Only 3 Companies in the 100-Billion Club
In terms of revenue data, the revenues of 130 listed pharmaceutical companies are concentrated in the range of RMB 1 billion to RMB 10 billion, accounting for 52.30% of the total number of companies included in the statistics. This is followed by the range below RMB 1 billion, which accounts for 33.8% of the total. There are 15 companies with revenues between RMB 10 billion and RMB 100 billion, while only three companies have revenues exceeding RMB 100 billion.
Number of Companies by Profitability Level (Unit: Number of Companies)
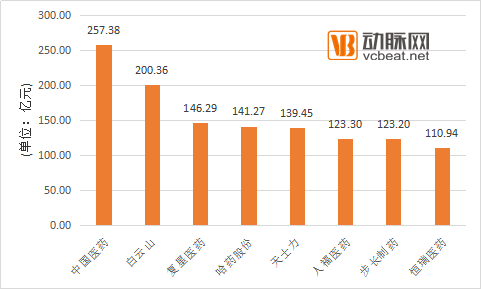
These three companies are Shanghai Pharmaceuticals, China Resources Pharmaceutical, and Sinopharm Group. Their core business is pharmaceutical distribution, with revenues of RMB 120.765 billion, RMB 139.3 billion, and RMB 258.388 billion, respectively. Sinopharm Group’s revenue is approximately equal to the combined revenues of China Resources Pharmaceutical and Shanghai Pharmaceuticals.
From the perspective of the overall revenue structure, the top-ranking companies by revenue are all pharmaceutical distribution firms. In addition to members of the “100-billion-yuan club,” Nanjing Pharmaceutical, Huadong Medicine, and RealCan Medicine are leading the industry.
From the perspective of industrial enterprises, Sinopharm, Baiyunshan, Fosun Pharma, Harbin Pharmaceutical Group, Tasly, Humanwell Healthcare, Buchang Pharmaceuticals, and Hengrui Medicine all reported revenues exceeding RMB 10 billion.
Enterprises with Annual Revenue Exceeding RMB 10 Billion
In terms of revenue changes, 11 A-share companies reported a decline in revenue, while three H-share companies saw year-on-year decreases. Tibet Rhodiola Pharmaceutical Holding Co., Ltd. recorded the most significant drop, with a year-on-year decline of 42.38%. Jiangzhong Pharmaceutical Co., Ltd., Chengzhi Co., Ltd., Tianjin Pharmaceutical Co., Ltd., and Chongqing Zhifei Biological Products Co., Ltd. also experienced varying degrees of decline.
A-share listed companies *ST Chuangliao, Guangyuyuan, Huayuan Biology, and Dian Diagnostics reported year-on-year revenue growth exceeding 100%, leading the industry. Excluding companies with declining revenues, the average revenue growth rate of A-share pharmaceutical listed companies was 27.09%, surpassing the overall growth rate of the pharmaceutical industry (the year-on-year growth rates of the total output value and sales revenue of China’s pharmaceutical industry in the previous year were 15.20% and 12.61%, respectively).
Net Profit: Up Nearly 60-Fold at Peak
In terms of net profit, members of the "100-billion-yuan club" continue to lead the industry, with Sinopharm Group, China Resources Pharmaceutical, and Shanghai Pharmaceuticals reporting net profits of RMB 6.892 billion, RMB 5.258 billion, and RMB 3.196 billion, respectively. Among other A-share listed pharmaceutical companies, 11 reported net profits exceeding RMB 1 billion, including Fosun Pharma, Hengrui Medicine, Dong-E-E-Jiao, Buchang Pharma, Jilin Aodong, and Baiyunshan.
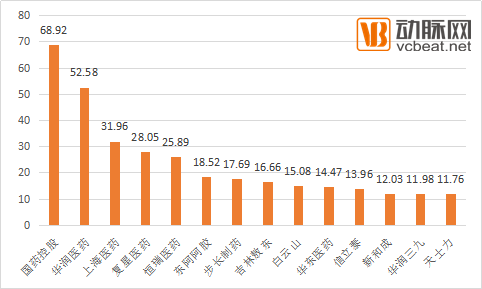
Pharmaceutical Listed Companies with Net Profits Exceeding RMB 1 Billion
The most outstanding performer was Guangyuyuan (600771.SH), which reported revenue of RMB 937 million during the reporting period, a year-on-year increase of 118.70%, and net profit of RMB 123 million, representing a nearly 60-fold year-on-year growth. Guangyuyuan attributed the surge in revenue and net profit to the combined drive of its “three carriages”: traditional Chinese medicine, premium Chinese medicine, and health-preserving liquor. Data showed that these three business segments generated revenues of RMB 580 million, RMB 179 million, and RMB 40 million, respectively, with gross profit margins all exceeding 80%.
Overall, among the 130 listed pharmaceutical companies included in the statistics, 18 reported net profits exceeding RMB 1 billion, 75 fell within the RMB 100 million to 1 billion range, and 37 recorded net profits below RMB 100 million.
Interestingly, companies with net profits exceeding RMB 1 billion accounted for approximately half of the total profit (RMB 52.1 billion), meaning that the combined net profit of the remaining 112 companies was equal to that of the top 18 companies.
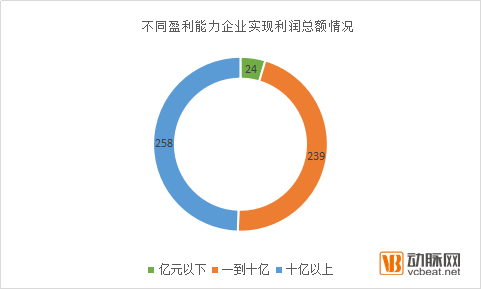
Net Profit Totals by Enterprise Profitability Scale
This data also sufficiently demonstrates that the pharmaceutical industry is a monopolistically competitive sector, largely conforming to the “Pareto Principle” (80/20 rule). It indirectly underscores the importance of R&D investment in the pharmaceutical sector: by leveraging early-stage R&D spending to build robust competitiveness, companies can establish competitive barriers and long-term monopoly mechanisms, thereby reaping the dividends generated by their initial investments.
R&D Investment: Generally Low
We selected the top 10 pharmaceutical companies by industrial revenue as a sample to measure the overall level of R&D investment.
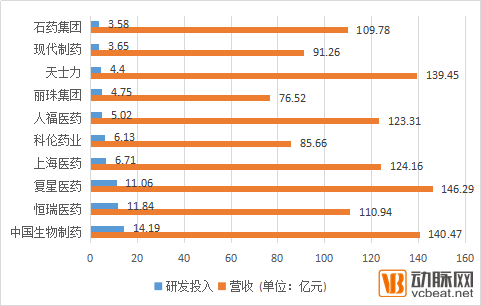
List of Companies with Leading R&D Investment
The combined industrial revenue of these ten companies amounted to RMB 114.784 billion, with total R&D investment reaching RMB 7.133 billion, accounting for 6.21% of their revenue. By company, China Biopharmaceutical and Hengrui Medicine both allocated more than 10% of their revenue to R&D, while CSPC Pharmaceutical Group had the lowest R&D intensity, at approximately 3% of its total revenue.
We selected Hengrui Medicine and Tasly as samples to analyze the R&D investment of listed pharmaceutical companies, focusing on manufacturers of generic drugs and traditional Chinese medicine preparations.
Hengrui Medicine reported revenue of RMB 11.094 billion during the reporting period, with R&D expenditure amounting to RMB 1.184 billion, representing an R&D intensity of 10.67%. According to data from PharmaCube, Hengrui Medicine’s R&D spending has risen steadily over the past six years, surging from RMB 400 million in 2011 to RMB 1.184 billion in 2016. Last year, the company’s R&D intensity exceeded 10% for the first time.
Annual report data show that Hengrui Medicine has invested approximately RMB 200 million in cumulative R&D expenditures for its ten major drug candidates under development, with most having entered clinical trials and regulatory submission stages, and some being the first generic versions approved in China.
As of the end of the reporting period, Hengrui Medicine’s R&D team comprised 2,142 members, including over 1,000 individuals with master’s or doctoral degrees and more than 100 foreign employees. R&D personnel accounted for 17% of the total workforce. In other words, one out of every six Hengrui Medicine employees is engaged in research and development.
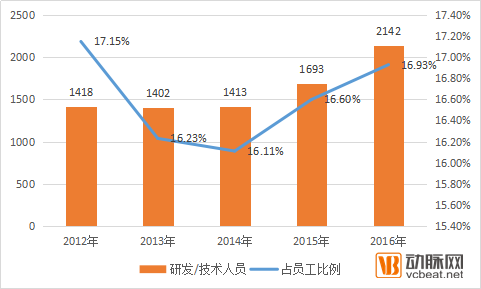
Number and Proportion of R&D/Technical Personnel at Hengrui Medicine
During the reporting period, Tasly’s pharmaceutical manufacturing segment generated revenue of RMB 6.178 billion, with R&D expenditures amounting to RMB 440 million, representing an R&D intensity of 7.12%. Statistics further indicate that Tasly has maintained its R&D spending at approximately 7% of its pharmaceutical manufacturing revenue over the past five years, establishing it as a benchmark enterprise for R&D among domestically listed traditional Chinese medicine (TCM) companies.
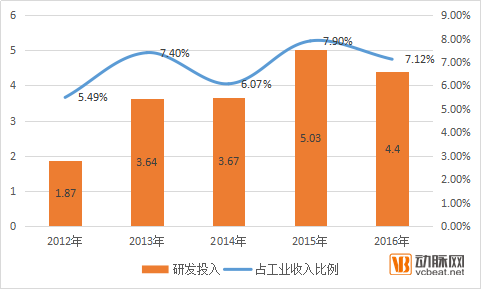
Tasly's R&D Investment and Proportion Changes in Recent Years
Previously, Tasly announced that its Compound Danshen Dripping Pills had completed the Phase III clinical trial with the U.S. FDA. Multicenter, randomized, double-blind, placebo-controlled parallel-group clinical trials have demonstrated that Compound Danshen Dripping Pills are safe and effective in the treatment of chronic stable angina pectoris.
This can also be seen as a microcosm of Tasly’s R&D investment and output, holding significant importance for both Tasly and the internationalization of traditional Chinese medicine.
Globally, leading innovator and generic drug companies alike allocate more than 20% of their revenues to R&D. Taking Roche as an example, its pharmaceutical division generated approximately $39 billion in revenue in 2016, with R&D expenditures reaching $11.58 billion, representing an R&D intensity of 29.6%. Chinese pharmaceutical companies still have substantial room for improvement in both their willingness to invest in R&D and their practical implementation.
Strategy: Align closely with policies and accelerate diversified operations
In their annual reports, numerous listed pharmaceutical companies stated that 2016 was a landmark year for policy developments in the pharmaceutical industry. Healthcare reform has truly entered its most challenging phase, intensifying the transformations facing industry development, with opportunities and challenges coexisting.
Throughout 2016, a series of pharmaceutical policies were issued by functional departments including the State Council, the China Food and Drug Administration (CFDA), the Ministry of Commerce, the Ministry of Human Resources and Social Security, the National Health and Family Planning Commission, and the National Development and Reform Commission. These policies covered drug review and approval, adjustments to the national medical insurance catalog, consistency evaluation, the replacement of business tax with value-added tax (VAT), and the “two-invoice” system. Some of these policies took effect in the previous year, while others included transitional periods.
A systematic understanding of these policies reveals that the most immediate objectives are “structural adjustment and standardization promotion.” This entails restructuring the supply side of the pharmaceutical industry to both meet pharmaceutical consumption demands and enhance innovation and original research capabilities. The VAT reform, the Two-Invoice System, and Document No. 94 directly target irregularities in the existing production and distribution systems, urging the industry toward healthy development.
From the perspective of structural adjustment, the first priority is the consistency evaluation of quality and efficacy for generic drugs. As a major producer of generic drugs, China holds approximately 180,000 domestic drug approval numbers, the majority of which are for generics. The consistency evaluation covers more than 80,000 approval numbers and involves over 2,500 manufacturers.
The greatest impact of the consistency evaluation on enterprises lies in costs. The cost for a single drug ranges from RMB 3 to 5 million, but since a company often holds dozens or even hundreds of approval numbers, the total cost of consistency evaluation can reach hundreds of millions of yuan. This places high demands on the profitability of pharmaceutical manufacturing enterprises.
The aforementioned revenue analysis also reveals that one-third of listed pharmaceutical companies generate annual revenues below RMB 1 billion. Taking into account unlisted small-scale pharmaceutical enterprises, the costs associated with the Generic Drug Quality and Efficacy Consistency Evaluation may prompt companies to discontinue certain products with limited market share and significant disparities between revenue and costs, thereby facilitating further market expansion for high-quality drugs.
Another factor is the approval process for new drugs. The "2016 Drug Evaluation Report" released by the Center for Drug Evaluation (CDE) of the China Food and Drug Administration shows that there were 3,779 new drug registration applications handled throughout the year, representing a significant drop compared to previous years and a 54% decrease from 2015.
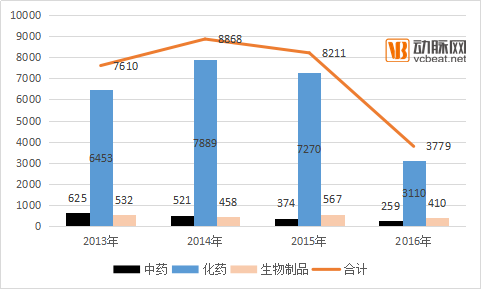
Comparison of Drug Registration Application Acceptance in 2016 with the Previous Three Years
Analysis suggests that China’s foundation for new drug development is weak, having experienced phases of disorder and overheating. This was characterized by a surge in registration applications for so-called “new drugs” flooding the regulatory approval authorities, driven by market interests. The establishment of verification and traceability procedures for clinical data has helped control the incremental growth of drug approval numbers and improve the quality of drug development and submissions.
Multiple pharmaceutical manufacturers included in the statistics stated in their annual reports that they would strictly control quality, ensure the accuracy of clinical data, actively respond to the consistency evaluation, and orderly conduct new drug applications. This can also be seen as a manifestation of pharmaceutical manufacturers closely following policies, which has a significant impact on the pharmaceutical supply chain.
In terms of promoting standardization, the most notable measures have been the replacement of business tax with value-added tax (VAT) and the “Two-Invoice System.” The VAT reform has eliminated the source of invoices for illegal invoice trafficking and affiliation arrangements, thereby removing the operational basis for individual pharmaceutical agents and agency companies, and making the structure of pharmaceutical marketing channels more transparent.
Furthermore, the Two-Invoice System, although it only affects the hospital channel, has eliminated multi-tiered pharmaceutical distribution agencies, prompting some commercial companies to consider transformation.
Policy factors have placed pharmaceutical companies in a position of multiple dilemmas and pressures. Some enterprises have begun to explore diversified operations to mitigate the impact of slowing growth in the pharmaceutical sector, actively venturing into mobile healthcare, internet-based healthcare, health supplements, cosmetics, and fast-moving consumer goods (FMCG).
Multiple listed pharmaceutical companies stated in their annual reports that they would focus on their core pharmaceutical businesses, actively expand into upstream and downstream segments of the industry chain as well as related areas, enhance group diversification and revenue levels, and respond to policy pressures and the impact of industry transformation.
Analysis suggests that policy changes, demographic shifts, consumption upgrades in pharmaceuticals and medical services, and endogenous corporate factors are all driving strategic adjustments among pharmaceutical companies, with many firms having responded proactively.