U.S. Drug Price Trends: Consumers Fail to Benefit from Slowing Price Growth
Pharmaceuticals are closely tied to public health, and the tension between drug development and profitability has become an enduring topic. The United States is the second country in the world that allows pharmaceutical companies to directly market prescription drugs to consumers (the other being New Zealand, with a population of less than 5 million).
As the most important hub for new drug development and promotion, the United States has consistently maintained the highest pharmaceutical expenditure globally. According to data from the American Medical Association (AMA), between 2008 and 2015, the prices of more than 400 generic drugs increased by over 1,000%.
Quintiles IMS, a global leader in pharmaceutical industry information and strategic consulting services, released its 2016 report titled “U.S. Drug Use and Spending.” The report noted that the rate of price increases for prescription drugs in the United States had slowed in 2016.
But in reality, have Americans truly benefited? Recently, experts from Forbes and MedCity News provided commentary on the current changes in U.S. drug prices. VCBeat (WeChat ID: vcbeat) has compiled and translated these perspectives to help you understand the trends in U.S. pharmaceutical pricing over the past year and their impact on consumers, pharmaceutical companies, insurers, and other stakeholders.
Fewer than Half the New Drug Varieties of the Previous Two Years, with Lower-Cost Generics Emerging
In 2016, total U.S. spending on prescription drug invoice prices amounted to $450 billion, with a growth rate less than half that of the previous two years.Net spending on pharmaceuticals amounted to $323 billion, representing a 4.8% increase over 2015 levels after adjusting for estimated rebates and other manufacturer price concessions. The number of new drug launches in 2016 was less than half that of the preceding two years, while expenditure on new drugs also declined.。
VCBeat believes that the continuous rise in patients' medication usage is partly due to more patients gaining access to insurance coverage and lower-cost generic drugs.. However, a small number of patients still face substantial out-of-pocket costs, and their trends in pharmaceutical expenditures differ markedly from those of other patients and the healthcare system at large.
The report predicts that it is expectedIn 2021, pharmaceutical expenditure will be moderated by further clusters of innovative therapies, offsetting the growing impact of various generic drug brands, thereby keeping the drug price growth rate at approximately 5%.. During this period, pharmaceutical manufacturers will focus more on enhancing market competitiveness and adopt a more cautious approach to drug pricing, resulting in more moderate increases in the invoice (and net) prices of pharmaceuticals.
Consumers Are Not Benefiting from the Slowdown in Drug Price Growth
Matthew Herper, Forbes Columnist
It is widely believed that prescription drug costs in the United States are continuing to rise uncontrollably. Although, according to a report by the Quintiles IMS Institute, the increase in drug prices in 2016 was only half that of the previous year; moreover, the average out-of-pocket expenses for consumers have decreased. Nevertheless, consumers do not feel that their medication burden has become lighter as a result.
In this regard, the Quintiles IMS report provides a very clear explanation:Patients were required to switch to more branded medications, while their insurers and employers pocketed the rebates.. This is also one of the reasons behind the high-profile price hike controversy surrounding Mylan’s EpiPen.
Moreover, new drugs used for conditions such as cancer and hepatitis C virus (collectively referred to as specialty drugs) are indeed extremely expensive. Some companies have attempted to reap greater profits by sharply raising prices, as seen in the cases of Valeant Pharmaceuticals and the notorious pharmaceutical profiteer Martin Shkreli.
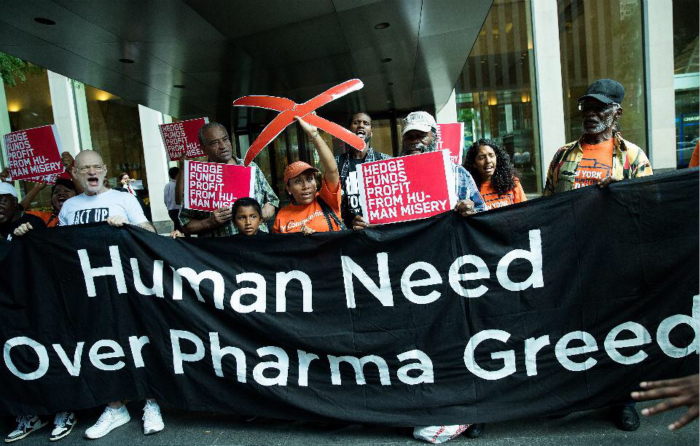
Protesters Gather Outside Hedge Fund Manager John Paulson’s Office to Protest EpiPen Price Hikes. New York City, August 30, 2016. (Photo by Drew Angerer / Getty Images)
In 2016, pharmaceutical spending at pharmacies reached $450 billion, a year-on-year increase of 5.8%, down from 12.4% in 2015. However, 28% of this amount did not go to pharmaceutical companies but was instead captured by intermediaries or returned to insurers in the form of rebates.
Quintiles IMS noted that, based on net drug prices, sales in 2016 amounted to $323 billion, representing a year-on-year increase of 4.8%. In other words, the total actual price of drugs should be less than $127 billion, reflecting a 17% increase compared to list prices.
In 2016, patients’ out-of-pocket costs decreased by $1.18 since 2013, reaching $8.47. However, for brand-name drugs, out-of-pocket costs increased by $111.61, or 48%, to $341.59. On average, medications have indeed become more affordable. Yet, in certain specific cases, patients must bear higher costs.
Why has this situation arisen? The reason is that, over time, patients will increasingly find it difficult to benefit from the discount rates negotiated by their insurance companies or intermediaries known as “pharmacy benefit managers,” unless these discounts are passed on in the form of lower premiums.If patients are required to pay a portion of the drug price, this portion is typically not included in the formulary price.
Quintiles IMS noted that the list prices of existing drugs rose by 9.2% last year, down from 12% in 2015. In contrast, the net prices of drugs increased by only 3.5%. This means that while market competition has continuously driven down drug prices, consumers are still forced to pay full price, unable to benefit from the savings generated by competition; meanwhile, all discounts are captured by employers and insurance companies.
Murray Aitken, Executive Director of Quintiles IMS, stated that this situation has plunged the U.S. pharmaceutical market into such aThe Vicious Cycle: Affordable Medications Are Free—For Instance, 89.5% of Prescribed Drugs Are Generics, and 29% Are Completely Free—Yet Consumers Are Increasingly Trapped by Costly Pharmaceuticals. Aitken explained that this means patients often have to stop taking their medications.
Thus, although the rate of increase in U.S. drug prices is indeed slowing down in numerical terms, many consumers have not benefited from this trend.Another ironic situation is that it was the pharmacy benefit managers (PBMs), including Express Scripts, CVS Caremark, and UnitedHealthcare, who helped slow down the rise in drug prices by negotiating lower prescription drug prices with pharmaceutical companies.. However, since they are also the ones controlling these substantial kickbacks, public attention will soon focus on them.
U.S. Pharmaceutical Spending Is Comparable to South Africa’s GDP

MedCity Reporter Juliet Preston
Juliet Preston, a New Zealander, is currently a pharmaceutical and biotechnology journalist at Medcity. In her coverage of Quintiles IMS’s report titled “Medicine Use and Spending in the U.S.,” Preston focused on total drug expenditure. She argues that although the report’s figures show that the growth rate of U.S. drug spending is only half that of the previous two years, this figure remains exceptionally high when viewed in a global context—indeed, it is comparable to South Africa’s projected 2017 GDP, a country with a population of 55 million.
In other words, according to data from the Quintiles IMS report, U.S. prescription drug spending in 2016 equaled the combined total of the next five largest pharmaceutical markets: China ($116.7 billion), Japan ($90 billion), Germany ($43.1 billion), France ($32.1 billion), and the United Kingdom ($27 billion).
So,Which drugs are responsible for such enormous expenditures? Unsurprisingly, at least half of the spending growth stems from new drugs approved over the past two years, including those targeting cancer and autoimmune diseases such as multiple sclerosis, HIV/AIDS, and diabetes.
Although fewer new drugs were approved in 2016, the biopharmaceutical sector remained highly active throughout the year. The report points out that there are currently 2,346 new products in late-stage development (i.e., Phase II, Phase III, or under regulatory review) in the United States alone. Among these pipeline candidates in late-stage development, approximately 37% are specialty drugs; and these drug categories are becoming increasingly expensive: in 2007, specialty drugs accounted for 21.8% of total pharmaceutical invoice expenditures, a figure that has now surged to 39.6%.
Of course, there is also a bright side to the future. Intensifying competition among manufacturers is driving down prices for drugs such as those for hepatitis C; meanwhile, payers will increasingly delay price increases. For instance, while the net price of protected brand-name drugs is projected to rise by 2–5% over the next five years, their invoice prices are expected to increase at a rate of 7–10%.
Why Does This Misalignment Exist? The report indicates that this reflects greater pressure and influence exerted by payers on drug pricing and prescribing, as well as changes in the brand-name drug portfolio in the market.
According to Quintiles IMS projections, total net pharmaceutical spending in the United States is expected to grow by 2–5% annually through 2021, reaching $375–$405 billion. Compared with the company’s report from the previous year, the overall level of pharmaceutical expenditure remains largely unchanged, but the projected annual growth rate has been revised downward from the previously estimated 4–7%.
[References]
https://www.forbes.com/sites/matthewherper/2017/05/04/drug-prices-are-growing-at-the-slowest-rate-in-years-heres-why-it-doesnt-feel-that-way/#27721044163e
http://medcitynews.com/2017/05/report-us-drug-spending-south-africas-gdp/?rf=1
http://www.imshealth.com/en/thought-leadership/quintilesims-institute/reports