Web Applications and Genomics Companies Lead Q1 2018 Digital Health Investment Surge, According to STARTUP HEALTH Report
Recently, Startup Health released its Global Digital Health Funding Report for the first quarter of 2018. The report shows that the total investment and financing in the digital health sector this quarter amounted to $280 million, making it the highest-funded first quarter on record. This trend is attributed to the continuous growth of the investor ecosystem, as well as the emergence of numerous sexual health companies and new technologies.
Of the 191 financing and investment deals in the first quarter, Series B and later-stage financings accounted for the largest share, indicating that the digital health industry is gradually maturing.
As attention grows, capital continues to flow into the digital health sector. Supplier-centric solutions have attracted the largest share of funding, with these companies focusing more on hospital management and clinical workflows.
To date, 40 companies have completed at least two rounds of financing, while several new companies have secured funding exceeding their total amounts raised in 2017. Geographically, Europe and Asia dominate the fundraising landscape.
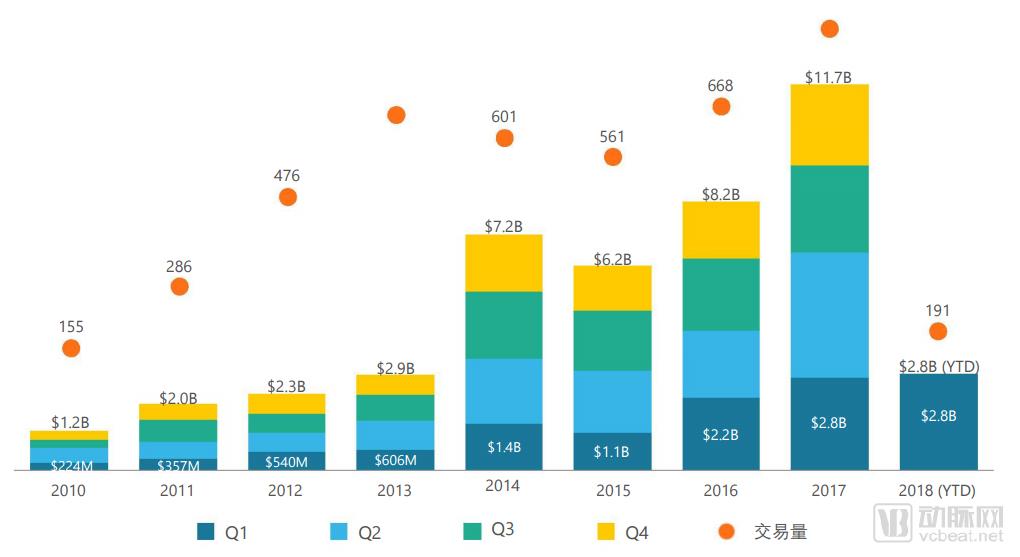
Sources of Funds: Year-over-Year Comparison
This quarter saw nearly 60 more financing deals than in the first quarter of 2017, and the total transaction volume surpassed that of the entire year of 2010. Excluding GRAIL’s financing round in 2017, the funding amount in the first quarter of 2018 would have been $900 million higher than that in the first quarter of 2017.
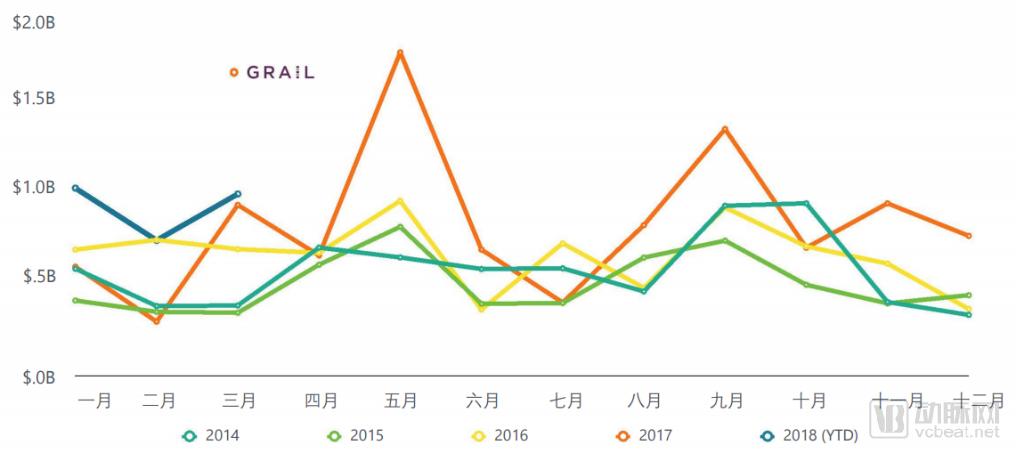
Source of Funds: Monthly Comparison
January 2018 was the month with the highest financing amount among all Januarys since 2013.
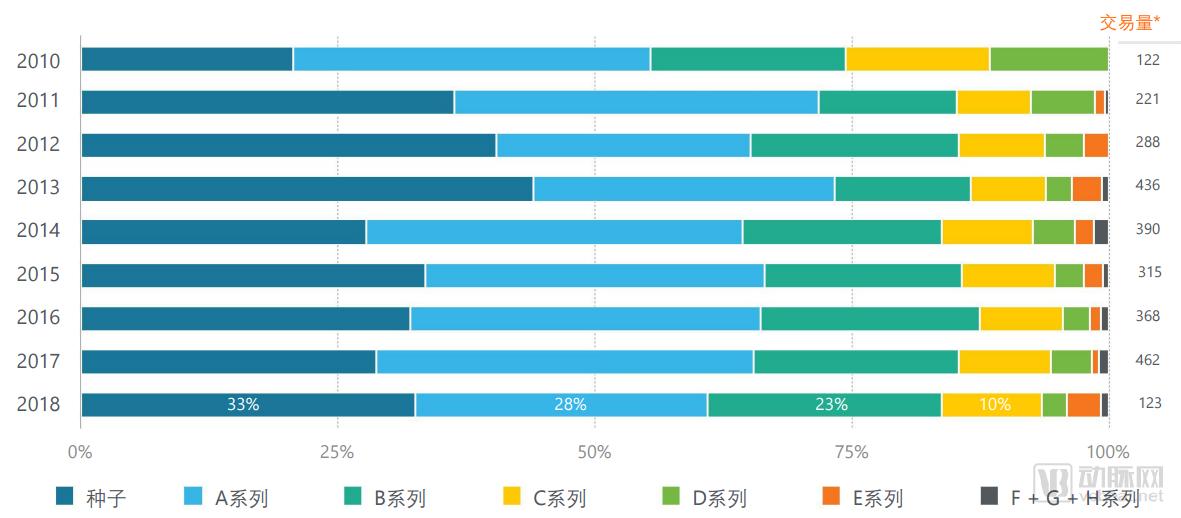
Transaction Activities at Each Stage
Early-stage financing (Seed and Series A) continued to account for the vast majority of total transactions, at 61% in Q1 2018, while post-Series D financing saw a slight increase.
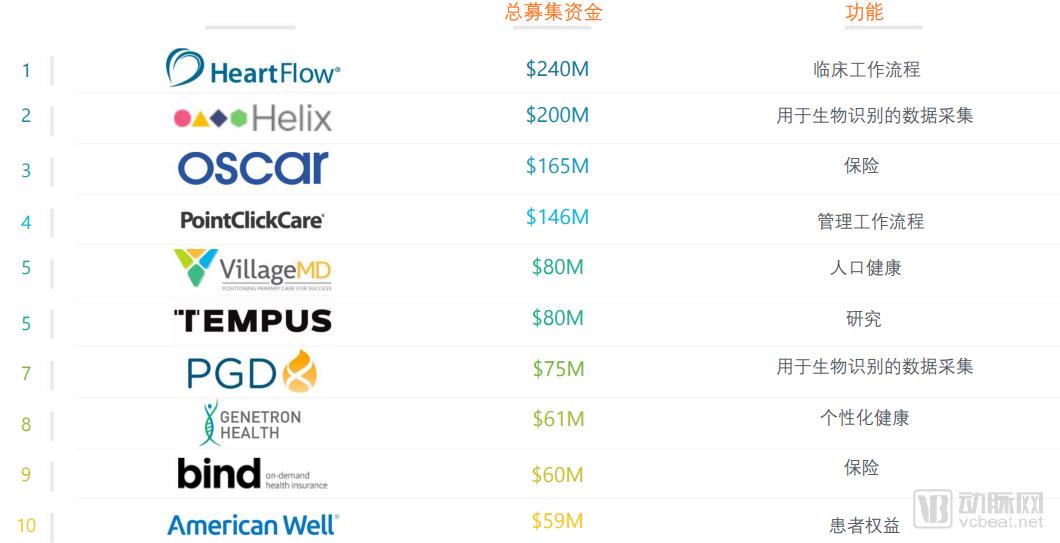
Top 10 Largest Deals from 2018 to Present
All of the top ten financings in Q1 exceeded $50 million each, with the top four deals totaling over $100 million, accounting for 42% of the total investment amount for the quarter.
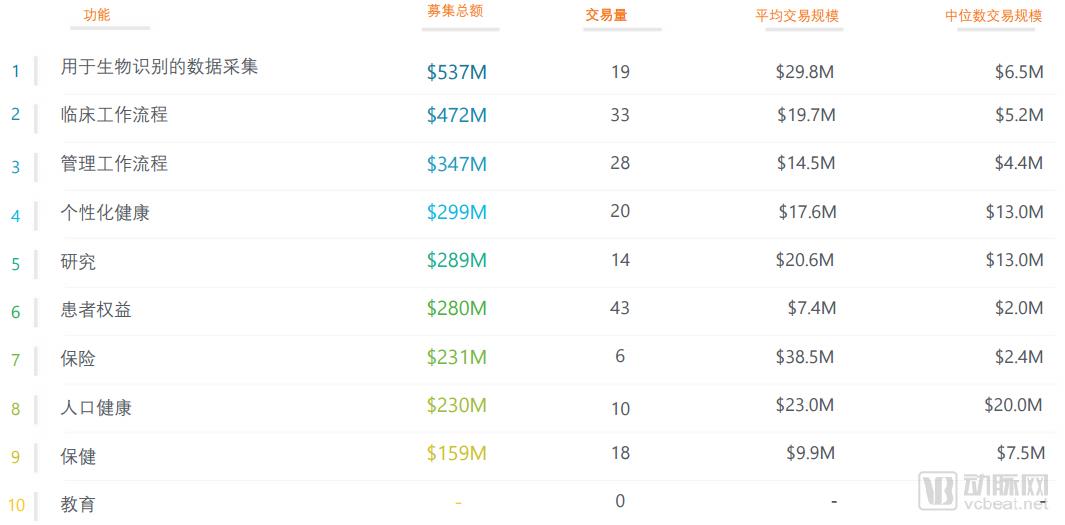
Most Active Features Since 2018
Biometric data collection companies secured the highest average funding amounts. Investors in this sector continue to shy away from long-tail R&D cycles, opting instead for faster-to-market solutions such as workflow management, clinical workflows, and personalized health.
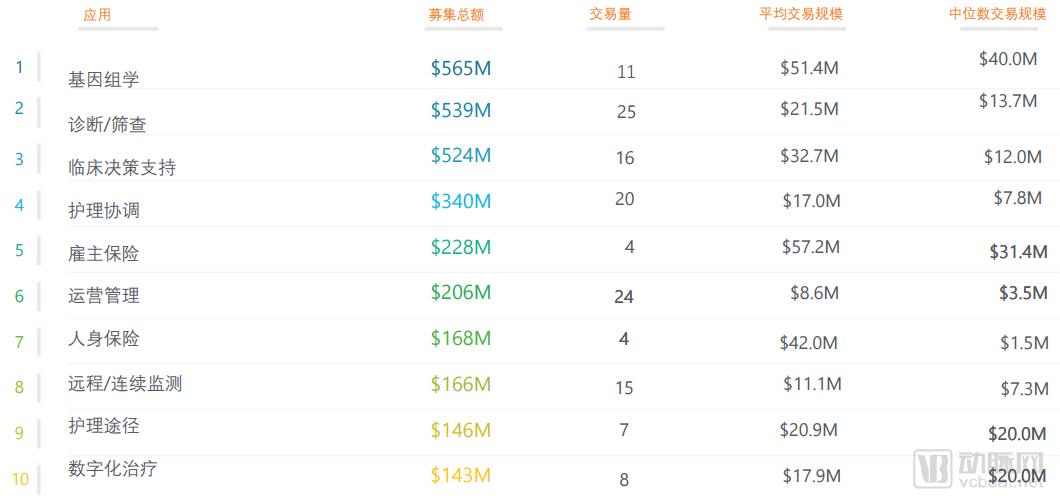
Top 10 Applications Since 2018
This quarter, financing for companies in the genomics, diagnostics/screening, and clinical decision support sectors each increased by more than $500 million. Most notably, there is a significant gap between the average and median financing sizes, with the median representing the midpoint of financing amounts. Entrepreneurs should take these emerging trends into account when considering capital raising and market positioning.
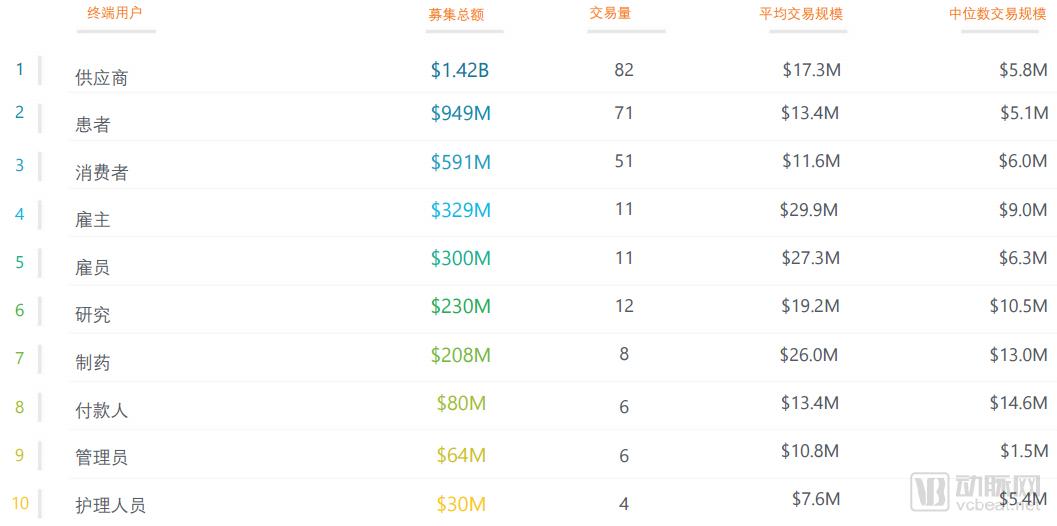
Top 10 Major End Users (2018–Present)
Among end users (organizations or individuals that benefit from corporate value), most funded companies still primarily serve healthcare providers, as reflected in their management workflow and clinical workflow functionalities. Although companies serving healthcare providers have secured twice as much funding as those serving patients, the average and median deal sizes remain relatively balanced.
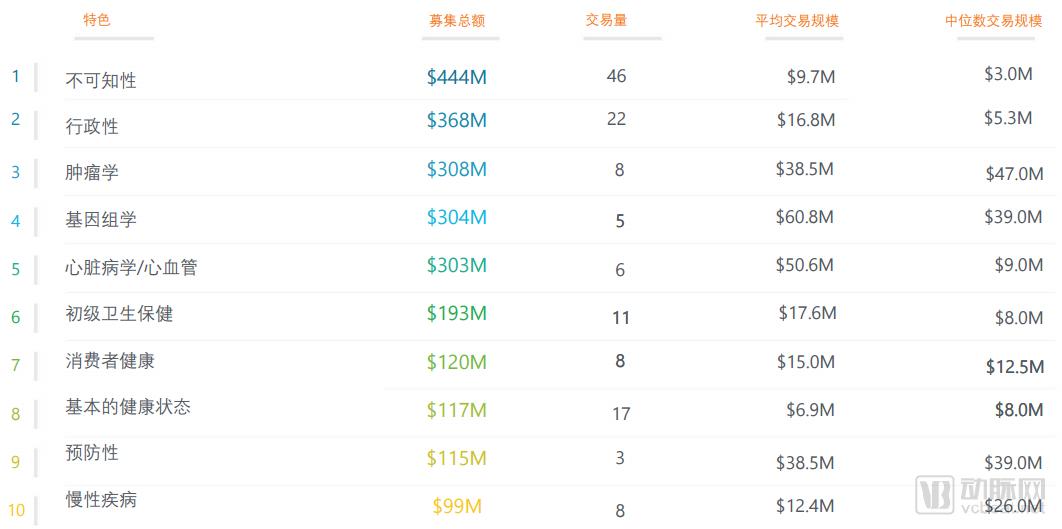
Top 10 Most Dynamic Featured Products (2018–Present)
Although most financing deals did not specify disease areas, a total of 31 transactions were closed in fields such as genomics and cardiovascular diseases, raising $907 million this quarter.
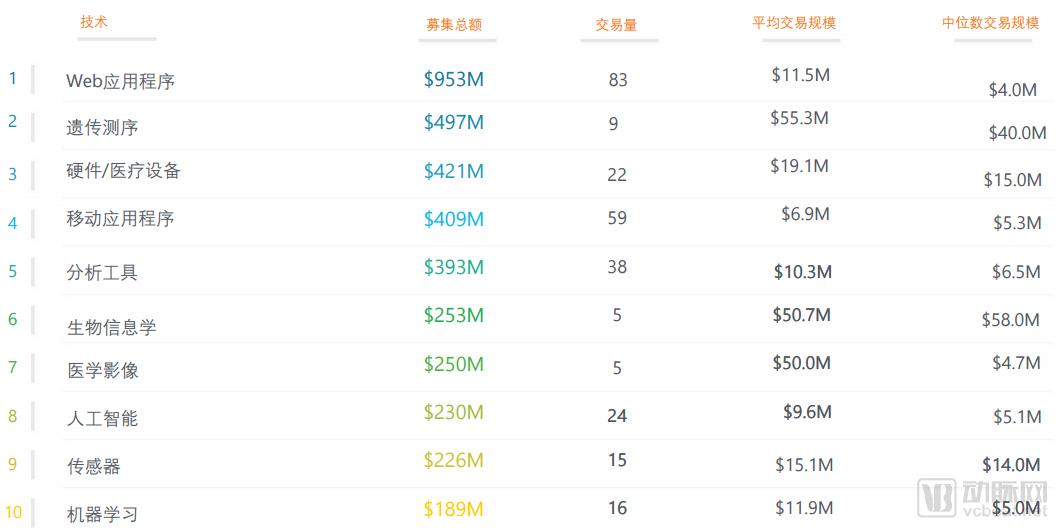
Top 10 Most Active Technologies Since 2018
Despite the persistent corporate hype surrounding artificial intelligence and machine learning over the past year, they ranked only 8th and 10th, respectively, among sectors securing venture funding. As the best-funded sector, web applications demonstrated strong momentum, raising $456 million more than gene sequencing.
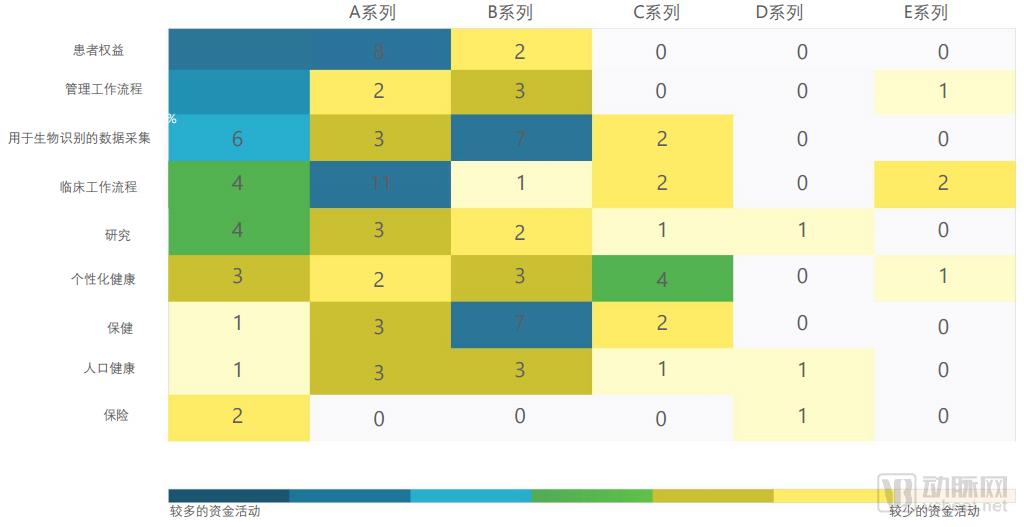
Market Maturity Map by Function, 2018 (to date)
Companies focused on patient advocacy and care management workflows are most likely to secure early-stage financing; those specializing in biometric data acquisition and health services are most likely to obtain Series B funding; while companies in personalized medicine typically raise Series C and subsequent rounds.
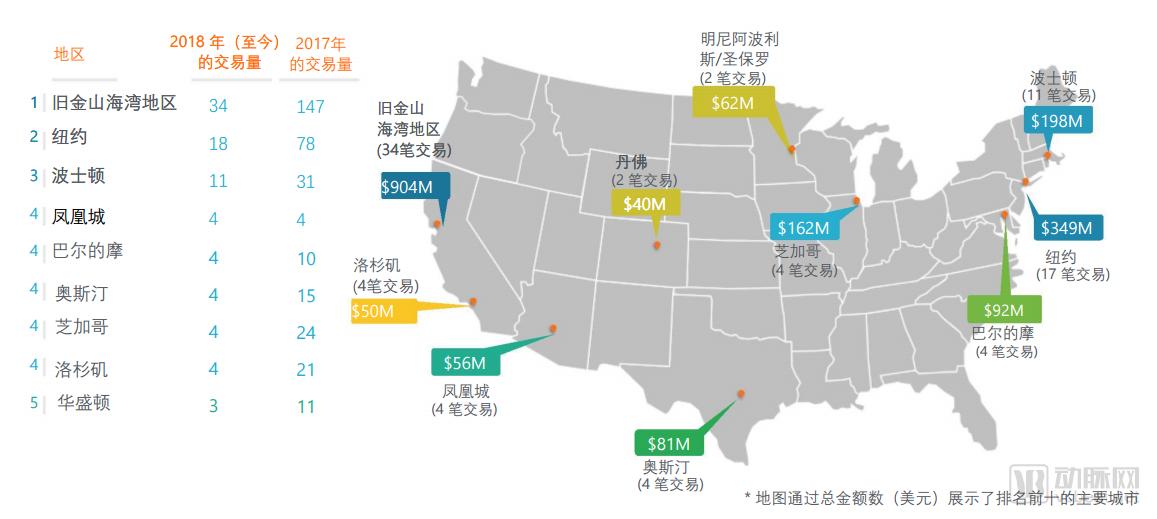
Most Active U.S. Hub Regions (2018–Present)
In the first quarter of 2018, several U.S. cities broke into the top 10 due to an increase in financing deals. The total investment amounts in Phoenix and Baltimore far exceeded their full-year financing totals for 2017, and both cities are on track to surpass their previous transaction volumes in 2018.
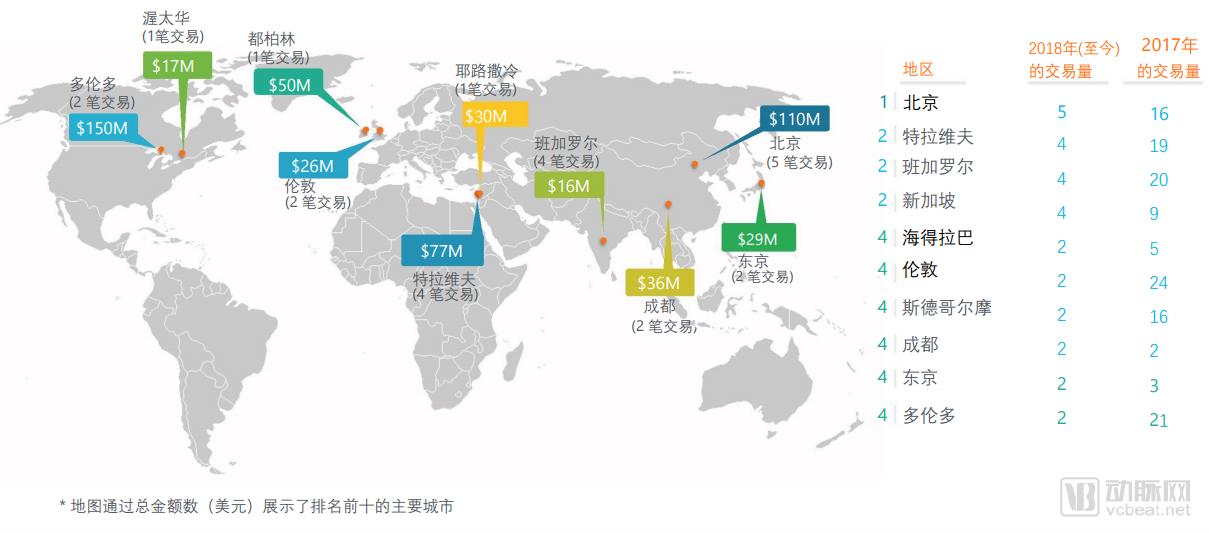
International Hub Station (2018–Present)
Israel and China remain the largest international hubs for digital health financing, with investment amounts of $107 million and $146 million, respectively, in the first quarter. New financing activities in Jerusalem (Israel) and Chengdu (China) were the main drivers of this growth.
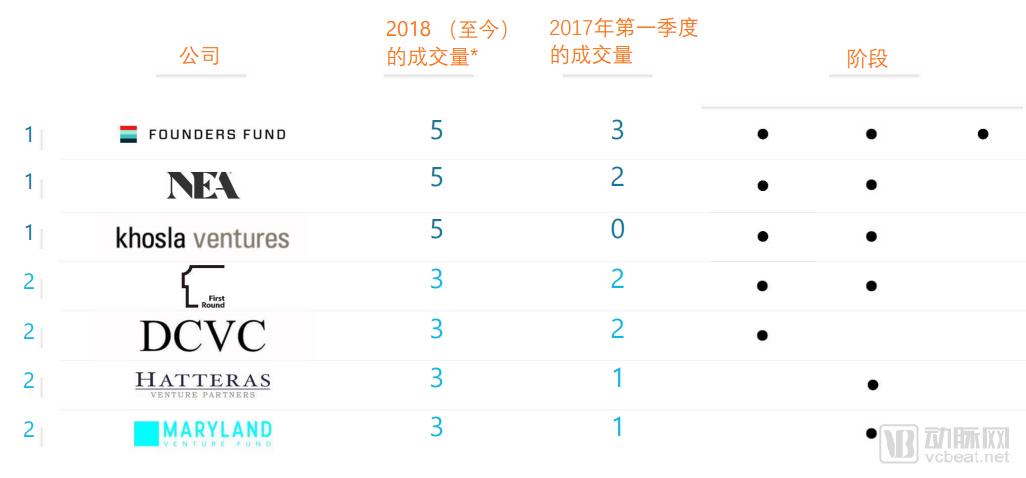
Most Active Investors (2018–Present)
Compared with the first quarter of 2017, top investors either increased or maintained their investments in digital health during the first quarter. By 2018, 33 investors had completed two rounds of investment and demonstrated strong interest in digital health deals.
This report is compiled from StartUp Health. VCBeat does not guarantee or warrant the reliability or completeness of the data, nor does it guarantee its fitness for any particular purpose.